
XAUUSD Technical Analysis — October 2026

XAUUSD Technical Analysis — October 2026
Gold Monthly Review & Research Archive
Historical price structure · Support and resistance · 4H / 1H / 15M research · 22 daily reports
October 2026 Gold Market Overview
ForexDevice’s recorded XAUUSD analysis documents a month that shifted from consolidation and intermittent recoveries to a sharper late-October decline. The daily chart shows price trading broadly around the $4,100–$4,200 area through much of the month before selling pressure intensified in the final third. Gold subsequently challenged the psychologically important $4,000 region.
Interpretation: The difference between these two recorded reference prices is −$148.50 (about −3.58%). This is not an official October open-to-close return: the archive prices were captured at different intraday times.
XAUUSD Daily Chart — October 2026 Price Structure
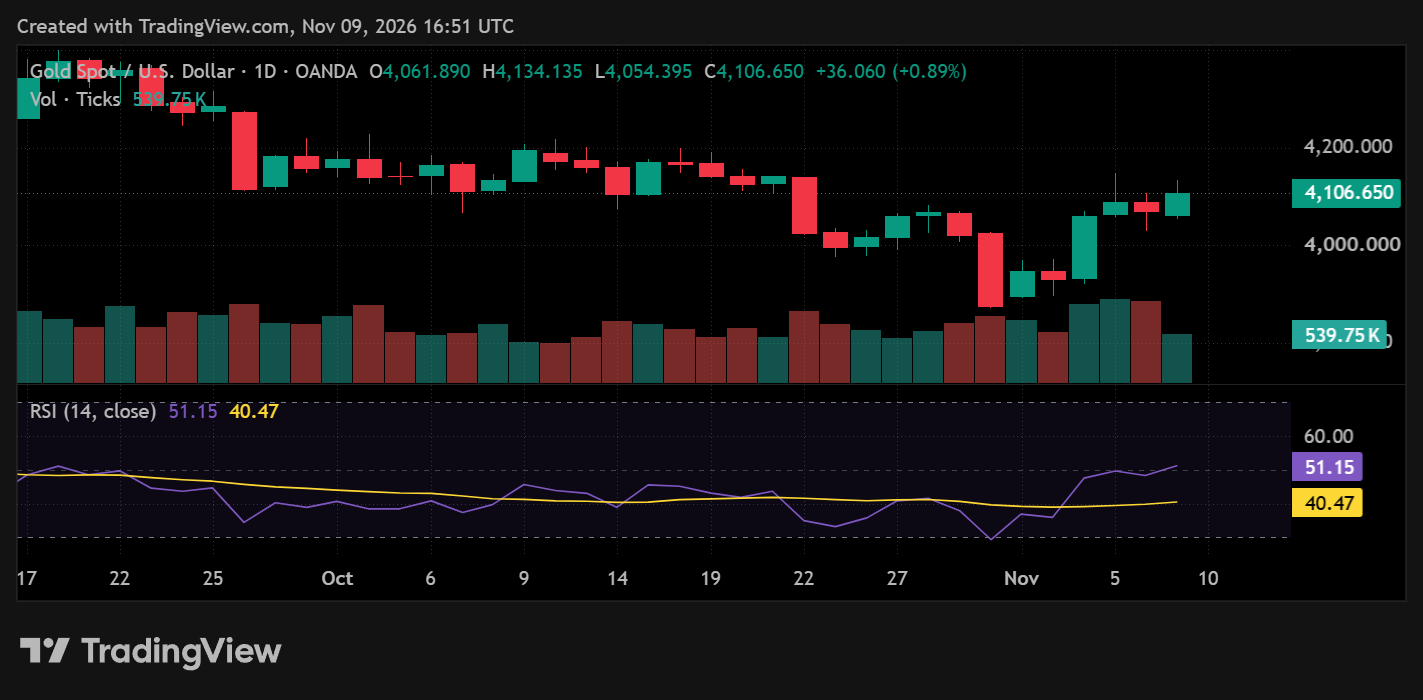
Source: TradingView, OANDA XAUUSD daily chart, captured 9 November 2026. Early-November candles and the displayed RSI are outside the October review period.
On the daily chart, late-October bearish candles and weaker price structure stand out more clearly than the shorter rebounds. The October archive also records the transition from mixed lower-timeframe signals around 12–19 October to coordinated selling around 20–23 October, followed by tactical rebounds that did not establish a durable month-end recovery.
XAUUSD Support and Resistance Levels — October 2026
These are historically recorded zones cited across ForexDevice daily research, not a claim that the same levels remain valid today. Support and resistance can change roles after a breakout or breakdown.
| Zone | Historical role | What October showed | Evidence |
|---|---|---|---|
| $4,199–$4,226 | Upper resistance band | Several mid-month reports identified overhead barriers near $4,199–$4,201, with higher boundaries around $4,217–$4,226. | 20 Oct · 13 Oct |
| $4,142–$4,170 | Intermediate reaction zone | Levels around $4,142, $4,155 and $4,170 repeatedly appeared as tactical resistance or support depending on the session. | 22 Oct · 16 Oct |
| $4,067–$4,105 | Earlier structural support; later pivot | Early and mid-month research monitored $4,067–$4,074 as structural support. As the decline progressed, the market traded below parts of this band. | 14 Oct · 23 Oct |
| $3,976–$4,004 | Late-month decision zone | By 26–30 October the $4,000 handle became the central psychological reference, with nearby recorded support around $3,976–$3,992 and resistance around $4,004–$4,019. | 26 Oct · 30 Oct |
Levels are drawn from dated research snapshots, not reconstructed tick-by-tick exchange data. The chart is a broker-specific spot-gold feed; small differences can occur across providers.
How Gold’s Structure Changed During October
1–9 October: Range trading with a bearish macro filter
Early reports frequently described bearish higher-timeframe conditions, but lower-timeframe recoveries also appeared. This was a period in which a 15-minute bullish signal could coexist with a bearish 4-hour structure. The distinction matters: a short-term bounce does not automatically signal a full trend reversal.
12–19 October: Resistance tests and mixed momentum
Price references climbed toward $4,208.67 on 12 October, while the 13–19 October reports showed alternating neutral, bearish and buy-biased archive outlooks. The repeated overhead references near $4,199–$4,217 help explain why confirmation at resistance mattered more than a single bullish candle.
20–23 October: Sellers regain control
The recorded reference moved from $4,132.54 on 20 October to $4,017.58 on 23 October. The 21–23 October archive entries showed sell bias, with the $4,074 area giving way as a useful earlier reference and the $4,000 psychological zone coming into focus.
26–30 October: A battle around $4,000
Price was recorded near $3,998.58 on 26 October, recovered to around $4,062.82 on 29 October, then returned near $4,004.85 on 30 October. That sequence illustrates how a countertrend recovery can develop without removing broader downside risk.
All 22 XAUUSD Daily Analysis Reports — October 2026
Browse every published weekday report, organized by trading week. Each row contains the recorded reference price, the archive’s overall outlook, the archive’s listed support and resistance, and a direct link to the original analysis. The outlook is not necessarily the same as the 4H trend label inside the full report.
1–2 October · Opening sessions
| Date | Recorded price | Archive outlook | Support / resistance | Research highlight | Article |
|---|---|---|---|---|---|
| 01 Oct | $4,153.35 | Sell | $4110 / $4170 | Early-month bearish structure | Full report ↗ |
| 02 Oct | $4,155.47 | Sell | $4139 / $4219 | Pressure near the 4,139 support area | Full report ↗ |
5–9 October · Early-month consolidation
| Date | Recorded price | Archive outlook | Support / resistance | Research highlight | Article |
|---|---|---|---|---|---|
| 05 Oct | $4,137.87 | Sell | $4139 / $4219 | Bearish alignment across timeframes | Full report ↗ |
| 06 Oct | $4,136.20 | Sell | $4139 / $4228 | Selling pressure persists | Full report ↗ |
| 07 Oct | $4,149.01 | Sell | $4104 / $4226 | Intraday weakness and consolidation | Full report ↗ |
| 08 Oct | $4,137.00 | Buy | $4104 / $4184 | 15M recovery against a bearish 4H backdrop | Full report ↗ |
| 09 Oct | $4,171.40 | Buy | $4067 / $4146 | Lower-timeframe recovery | Full report ↗ |
12–16 October · Resistance tests
| Date | Recorded price | Archive outlook | Support / resistance | Research highlight | Article |
|---|---|---|---|---|---|
| 12 Oct | $4,208.67 | Buy | $4067 / $4207 | Short-term momentum tests overhead levels | Full report ↗ |
| 13 Oct | $4,169.16 | Neutral | $4067 / $4217 | Mixed timeframe signals | Full report ↗ |
| 14 Oct | $4,163.43 | Sell | $4067 / $4201 | Bearish multi-timeframe alignment | Full report ↗ |
| 15 Oct | $4,148.78 | Buy | $4067 / $4201 | Short-term recovery within a cautious macro structure | Full report ↗ |
| 16 Oct | $4,158.12 | Buy | $4074 / $4201 | Recovery attempt and resistance testing | Full report ↗ |
19–23 October · Downside acceleration
| Date | Recorded price | Archive outlook | Support / resistance | Research highlight | Article |
|---|---|---|---|---|---|
| 19 Oct | $4,178.30 | Buy | $4074 / $4201 | Buy-side tactical momentum; macro caution | Full report ↗ |
| 20 Oct | $4,132.54 | Sell | $4074 / $4199 | Bearish continuation | Full report ↗ |
| 21 Oct | $4,117.46 | Sell | $4112 / $4132 | Synchronized selling pressure | Full report ↗ |
| 22 Oct | $4,109.29 | Sell | $4105 / $4142 | Breakdown risk and oversold intraday conditions | Full report ↗ |
| 23 Oct | $4,017.58 | Sell | $4074 / $4142 | Accelerating decline toward 4,000 | Full report ↗ |
26–30 October · The $4,000 battle
| Date | Recorded price | Archive outlook | Support / resistance | Research highlight | Article |
|---|---|---|---|---|---|
| 26 Oct | $3,998.58 | Sell | $3992 / $4004 | Price tests the 4,000 psychological level | Full report ↗ |
| 27 Oct | $4,010.45 | Sell | $3976 / $4142 | Bearish pressure around 4,000 | Full report ↗ |
| 28 Oct | $4,055.26 | Buy | $4058 / $4071 | Tactical rebound | Full report ↗ |
| 29 Oct | $4,062.82 | Buy | $4025 / $4142 | Recovery attempt meets resistance | Full report ↗ |
| 30 Oct | $4,004.85 | Sell | $4005 / $4019 | Month ends under renewed selling pressure | Full report ↗ |
Five Lessons October’s XAUUSD Market Offered Traders
- Separate trend from countertrend: Lower-timeframe buy signals in early and mid-October sometimes appeared beneath bearish higher-timeframe conditions.
- Watch support-to-resistance transitions: A support zone that fails can become an obstacle during a later recovery.
- Respect psychological prices: The $4,000 handle became an important late-month decision area, but a round number alone is not a trading signal.
- Avoid chasing extended moves: Late-October reports discussed oversold conditions even as the broader sell bias persisted.
- Compare dated forecasts with what happened next: The linked archive lets readers examine both useful signals and limitations, rather than judging analysis only in hindsight.
Continue researching: See the full XAUUSD daily analysis archive for subsequent months. This October hub is intentionally historical.
October 2026 XAUUSD Technical Analysis — FAQ
Was gold bullish or bearish in October 2026?
October’s daily chart and recorded research indicate a mixed earlier period followed by pronounced late-month selling pressure. Individual intraday reports sometimes showed bullish recoveries inside a more cautious higher-timeframe structure.
What were the important gold support and resistance levels in October?
Frequently referenced areas included upper resistance around $4,199–$4,226, intermediate pivots near $4,142–$4,170, earlier support around $4,067–$4,105, and the late-month $3,976–$4,004 decision zone. These are historical, date-dependent observations.
Where can I read the daily October gold forecasts?
The complete table above links to all 22 October weekday reports, with recorded price references and research highlights.
Are these levels suitable for trading gold today?
No. This page documents October 2026. For later sessions, consult the current ForexDevice daily XAUUSD research archive and independent live market data.