Analysis Last Updated: 13 October 2026 at 07:42 UTC
XAUUSD Technical Analysis & Structural Outlook
Daily Market Report — 13 October 2026
Multi-Timeframe Confluence • 4H / 1H / 15M
XAUUSD
4,169.16
4H Bias
BEARISH
1H Bias
BULLISH
15M
BEARISH
4H RSI
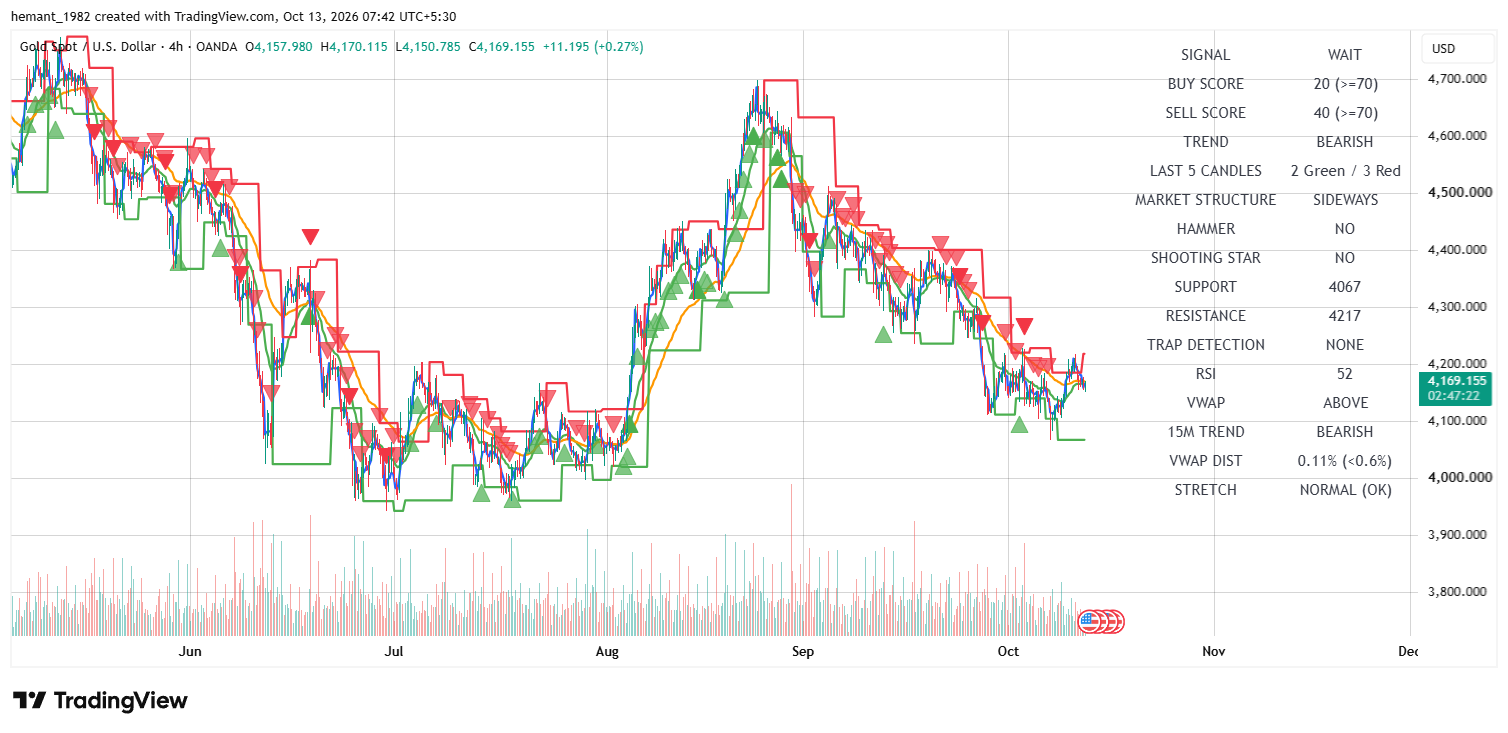
52
Decision Zone
4,067–4,217
Executive Summary
Gold exhibits mixed lower-timeframe behavior while higher 4H structures maintain a broader bearish macro filter on October 13, 2026.
XAUUSD is trading around 4,169.16 amid an active consolidation and testing phase.
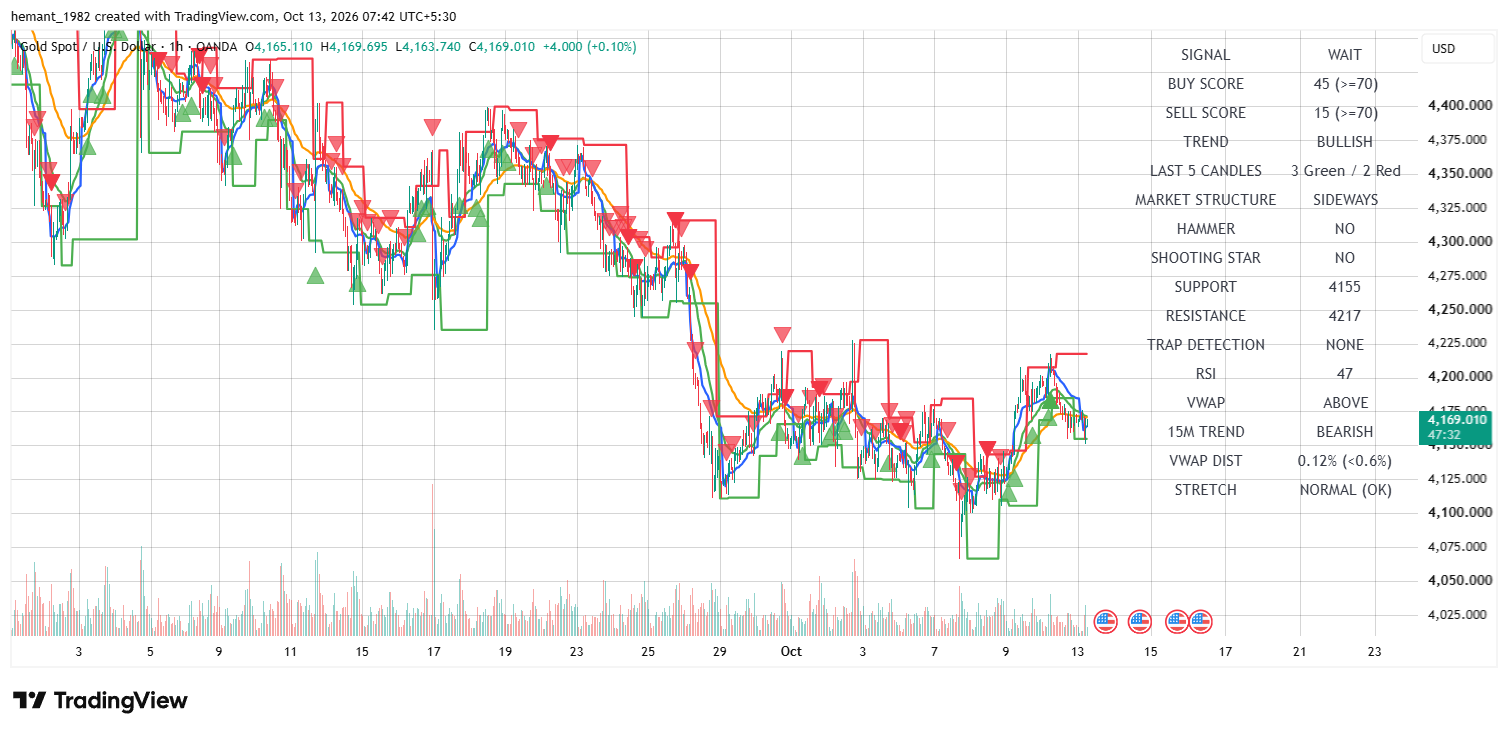
Structural alignment shows the 1H timeframe printing a BULLISH classification, while the macro 4H horizon and 15M execution view retain BEARISH bias tendencies.
The 4H RSI rests at neutral 52, indicating equilibrium after recent price swings.
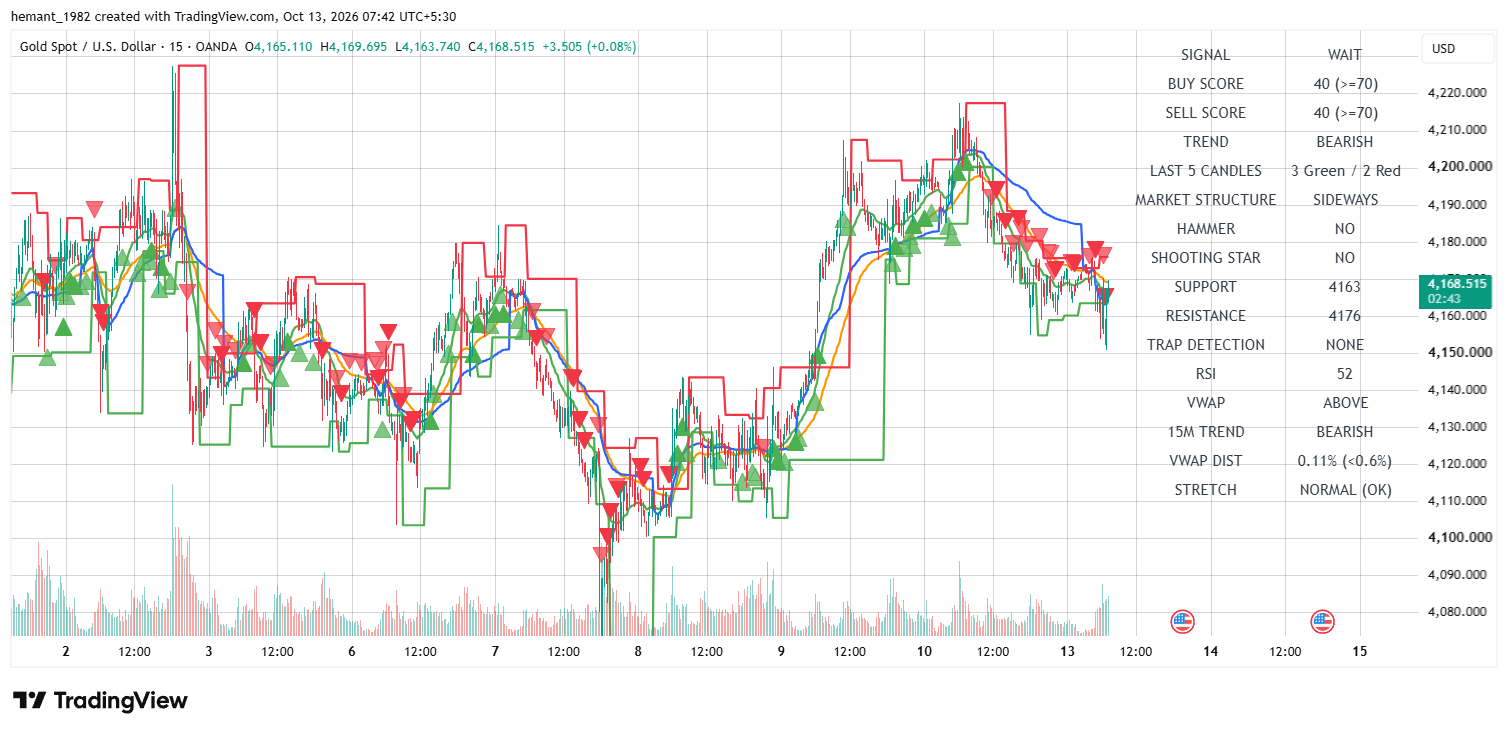
On the execution front, immediate structural boundaries are anchored between 4,067 and 4,217 on the 4H frame, while immediate 15M parameters highlight support at 4,163 and resistance at 4,176.
Participants should monitor these reaction zones carefully as market participants weigh short-term recovery attempts against macro resistance barriers.
Immediate overhead hurdle for short-term breakout attempts.
4,169.16
Current Market Price
Live trading reference evaluating immediate session strength.
4,217
4H Major Resistance
Macro higher-timeframe resistance ceiling for bullish continuation.
06 Scenario Analysis
Bullish Continuation
Buyers clear immediate resistance at 4,176, expanding short-term momentum toward higher targets. Sustained acceptance opens the path toward macro resistance near 4,217.
Bearish Reversal / Retracement
Overhead resistance holds, triggering selling pressure and a test of the 4,155 1H support floor. A breach of 4,155 re-exposes macro support at 4,067.
Consolidation Range
Price continues to consolidate within the tight 4,163–4,176 corridor as participants await clearer directional triggers. Patience is recommended until range boundaries are breached.
07 Trader Decision Framework
Current Bias
Mixed on lower horizons, bearish on 4H macro filter. Neutral momentum warrants a selective wait-and-see approach.
Immediate Zone
4,155–4,217 acts as the primary execution corridor for intraday positioning.
Bullish Trigger
Breakout and acceptance above 4,176 targeting 4,217 resistance.
Bearish Trigger
Clean breakdown below 4,163 execution support and 4,155 baseline.
Risk Condition
Balanced RSI readings (47–52) and equal buy/sell scores call for strict risk management.
Preferred Approach
Trade range boundaries or wait for confirmed breakout signals. Utilize strict stop placements outside immediate support levels.
08 Final Institutional Outlook
XAUUSD exhibits a neutral-to-mixed consolidation posture while interacting with broader 4H structures, trading near 4,169.16. The 4H timeframe maintains a bearish stance (RSI 52, buy score 20),
while the 1H timeframe holds an intermediate bullish baseline (RSI 47) and the 15M execution view displays balanced conditions with equal buy/sell scores of 40 and RSI at 52.
Market participants should monitor key tactical boundaries between 4,155 and 4,217 . A breakout beyond these levels will establish the next directional trend phase.
Strict adherence to risk controls and disciplined stop-loss placement remain vital during tight consolidation phases.
Bottom Line
Primary bias: Neutral / Cautious Consolidation. Exercise patience and await a decisive test of the 4,155–4,217 corridor before committing significant capital.
Risk Disclosure: This analysis is provided for educational and informational purposes only.
It represents a technical interpretation of the charts shown at the time
of publication and should not be considered investment advice, a guarantee
of future price movement, or a recommendation to buy or sell any financial
instrument. Trading leveraged instruments such as gold and CFDs involves
substantial risk. Always apply appropriate position sizing and independent
risk management.
265Active Online
🚀
🔒 Secure Checkout
↗ForexDeviceXAUUSD · Gold Market Intelligence
DAILY XAUUSD MARKET RESEARCH
XAUUSD Gold Analysis, Straight to Your Inbox.
Receive ForexDevice's published XAUUSD technical outlook, key price levels and Morning, London and New York session updates by email.
♢ForexDevice XAUUSD research emails only. Unsubscribe anytime. Your email is stored on this website.
Print your XAUUSD reportChoose your sessions, review the document, then print or save as PDF.
DOCUMENT PREVIEWLatest available session
Your browser's print dialog lets you choose a printer or Save as PDF. No report is published or changed.