Analysis Last Updated: 30 October 2026 at 08:00 UTC
XAUUSD Technical Analysis & Structural Outlook
Daily Market Report — 30 October 2026
Multi-Timeframe Confluence • 4H / 1H / 15M
XAUUSD
4,004.85
4H Bias
BEARISH
1H Bias
BEARISH
15M
BEARISH
4H RSI
39
Decision Zone
3,976–4,083
Executive Summary
Gold maintains heavy bearish structural control across all major timeframes as October 30, 2026 trading opens.
XAUUSD is trading around 4,004.85 under persistent downward pressure.
Structural metrics show complete multi-timeframe alignment with the 4H, 1H, and 15M charts printing BEARISH trends.
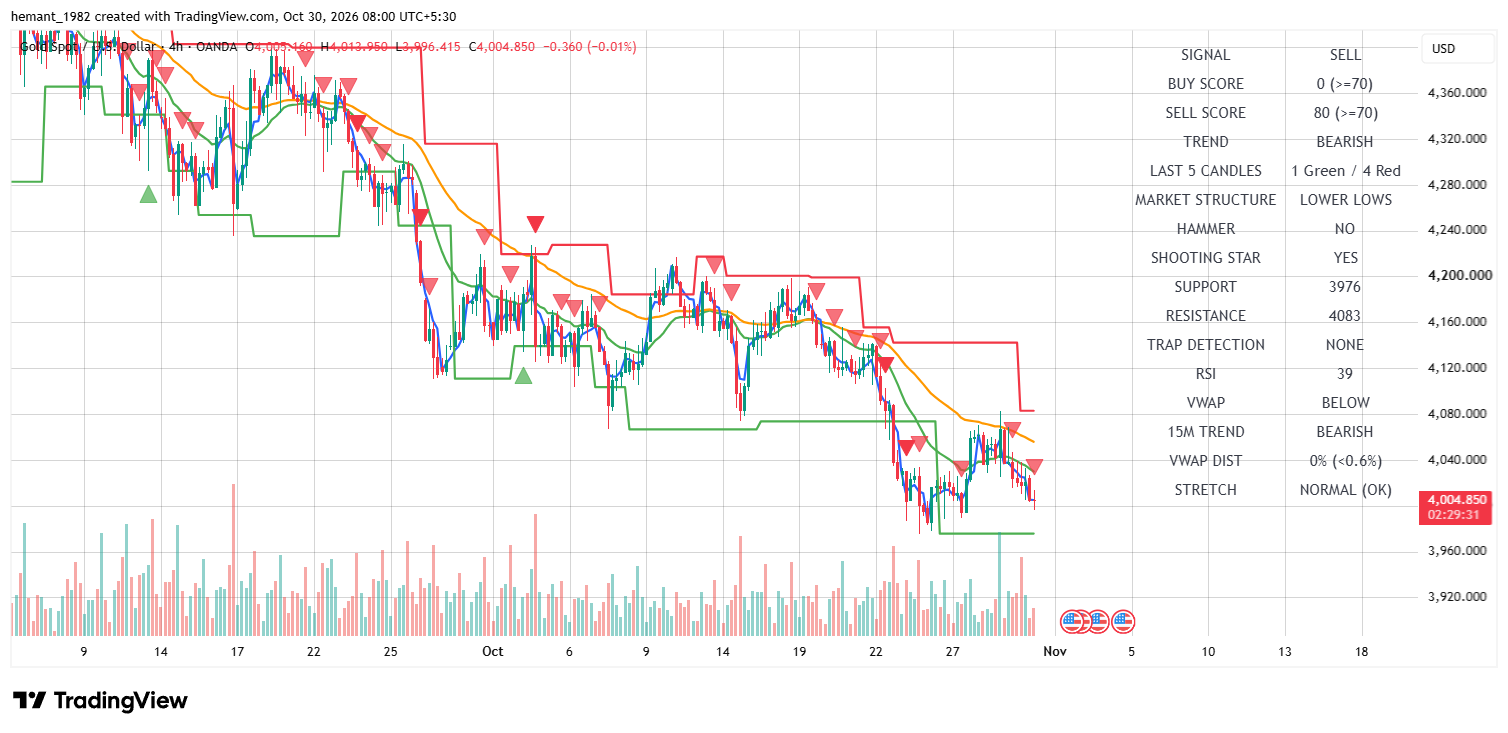
The 4H RSI remains suppressed at 39, reflecting sustained downside momentum and lower lows structure.
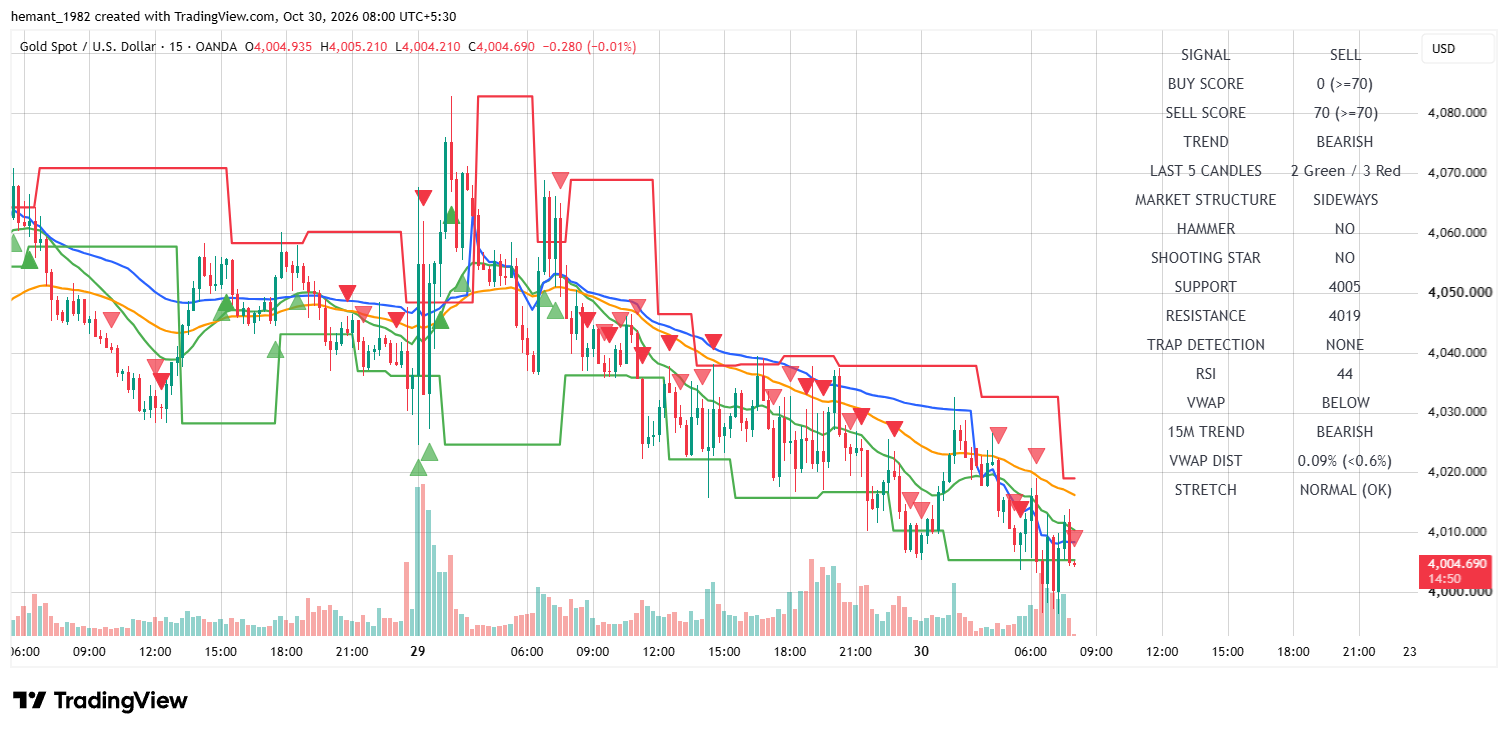
Macro structural boundaries are anchored between 3,976 and 4,083 on the 4H frame, while immediate 15M parameters highlight support at 4,005 and resistance at 4,019.
With price action below key VWAP indicators across timeframes, market participants should expect continued seller dominance.
Price remains constrained below key moving average bands and VWAP levels across all charts. Both the 4H and 1H timeframes feature Shooting Star technical patterns alongside elevated Sell Scores (80 on 4H, 95 on 1H).
With short-term momentum leaning downward and VWAP distance tight (<0.6%), selling pressure is poised to continue unless bulls can decisively break above intraday resistance boundaries.
02 4H Institutional View
Trend
Bearish
RSI
39
Market Structure
Lower Lows
VWAP
Below
Support
3,976
Resistance
4,083
The 4H timeframe confirms ongoing macro weakness, trading near 4,004.85 with a strict BEARISH trend signal.
Sell Score stands dominant at 80 (vs 0 Buy Score), supported by a confirmed Shooting Star candlestick signal. RSI prints at 39.
Structural support is established lower at 3,976, while major resistance forms a ceiling at 4,083.
4H Assessment
Strong institutional bearish bias driven by lower lows structure, 80 sell score, and price trading below VWAP.
03 1H Tactical Structure
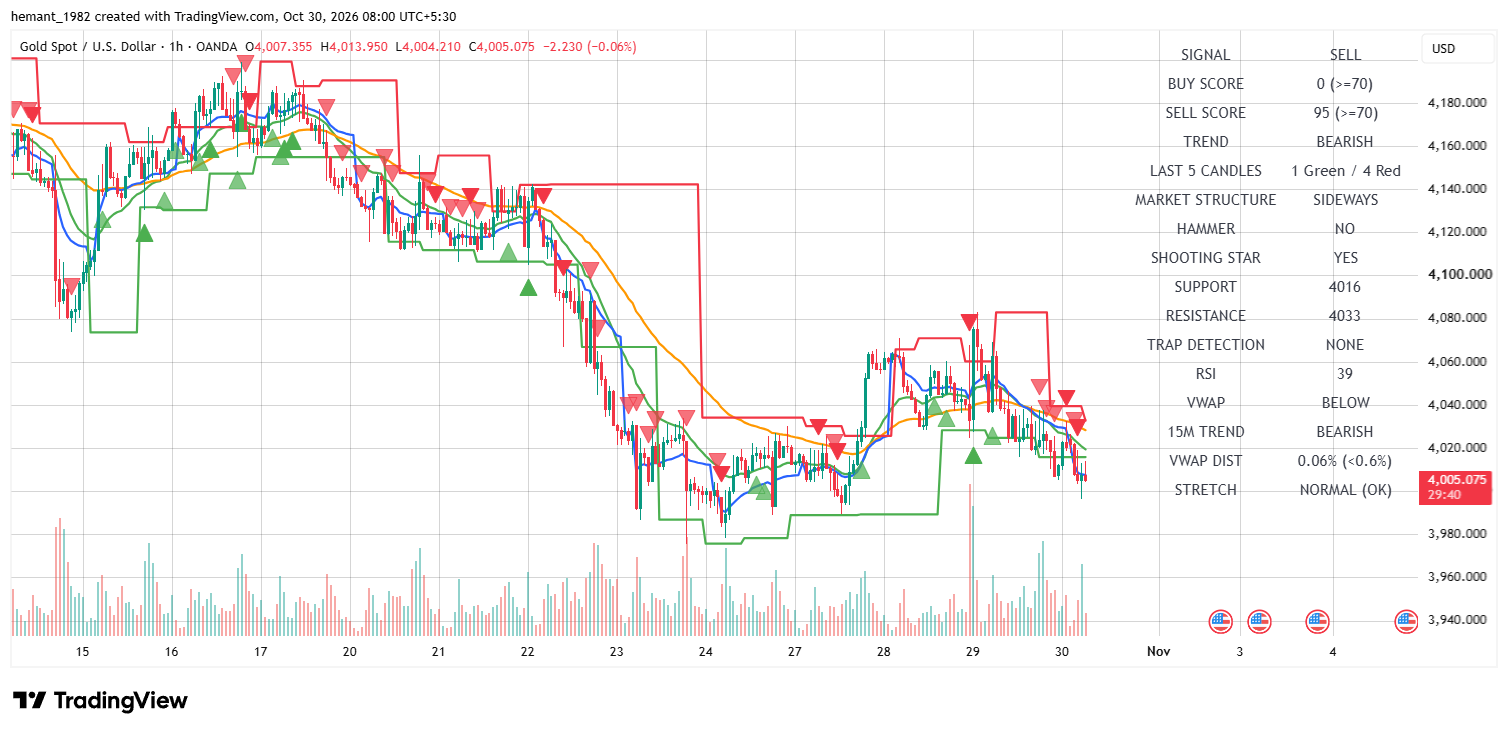
XAUUSD 1H — Intermediate consolidation within a overarching bearish trend and high sell score signal
Trend
Bearish
RSI
39
Sell Score
95
VWAP
Below
Support
4,016
Resistance
4,033
The 1H chart maintains a strong BEARISH bias accompanied by an exceptionally high Sell Score of 95 and RSI at 39.
Market structure indicates sideways consolidation following a steady downward trend, with price struggling below VWAP.
Tactical support is located at 4,016 (currently being tested/broken), with overhead resistance at 4,033.
Buyers defend 4,000–4,005 support zone, triggering a push back above resistance at 4,019.
Sustained momentum could extension towards 1H resistance at 4,033.
Bearish Continuation
Sellers push price cleanly below 4,005, continuing the multi-timeframe bearish extension toward macro 4H support at 3,976. High sell scores confirm trend alignment.
Consolidation Range
Price holds in a narrow band between 4,005 and 4,019 as the market digests recent declines prior to the next direction push.
07 Trader Decision Framework
Current Bias
Bearish alignment across 4H, 1H, and 15M timeframes.
Immediate Zone
4,005–4,019 defines the critical execution range.
Bullish Trigger
Strong breakout and close above 4,019, targeting 4,033 resistance.
Bearish Trigger
Confirmed breakdown below 4,005 support or rejection near 4,019 resistance.
Risk Condition
Tight distance to VWAP indicates stable momentum, but monitoring round-number behavior near 4,000 is critical.
Preferred Approach
Align with high Sell Scores (95 1H / 80 4H) by looking for sell continuation setups. Maintain strict stop levels above intraday resistance.
08 Final Institutional Outlook
XAUUSD displays a unified bearish market structure across all timeframes, trading near 4,004.85.
The 4H chart indicates lower lows with an 80 Sell Score, while the 1H timeframe prints a dominant 95 Sell Score and Shooting Star signal.
Immediate focus rests on key tactical boundaries between 4,005 and 4,019 .
A sustained break below 4,005 clears the way toward primary macro support targets at 3,976.
Bottom Line
Primary bias: Strongly Bearish. Downside bias remains active while price trades under 4,019–4,033 overhead resistance.
Risk Disclosure: This analysis is provided for educational and informational purposes only.
It represents a technical interpretation of the charts shown at the time
of publication and should not be considered investment advice, a guarantee
of future price movement, or a recommendation to buy or sell any financial
instrument. Trading leveraged instruments such as gold and CFDs involves
substantial risk. Always apply appropriate position sizing and independent
risk management.
262Active Online
🚀
🔒 Secure Checkout
↗ForexDeviceXAUUSD · Gold Market Intelligence
DAILY XAUUSD MARKET RESEARCH
XAUUSD Gold Analysis, Straight to Your Inbox.
Receive ForexDevice's published XAUUSD technical outlook, key price levels and Morning, London and New York session updates by email.
♢ForexDevice XAUUSD research emails only. Unsubscribe anytime. Your email is stored on this website.
Print your XAUUSD reportChoose your sessions, review the document, then print or save as PDF.
DOCUMENT PREVIEWLatest available session
Your browser's print dialog lets you choose a printer or Save as PDF. No report is published or changed.