Analysis Last Updated: 27 October 2026 at 07:40 UTC
XAUUSD Technical Analysis & Structural Outlook
Daily Market Report — 27 October 2026
Multi-Timeframe Confluence • 4H / 1H / 15M
XAUUSD
4,010.45
4H Bias
BEARISH
1H Bias
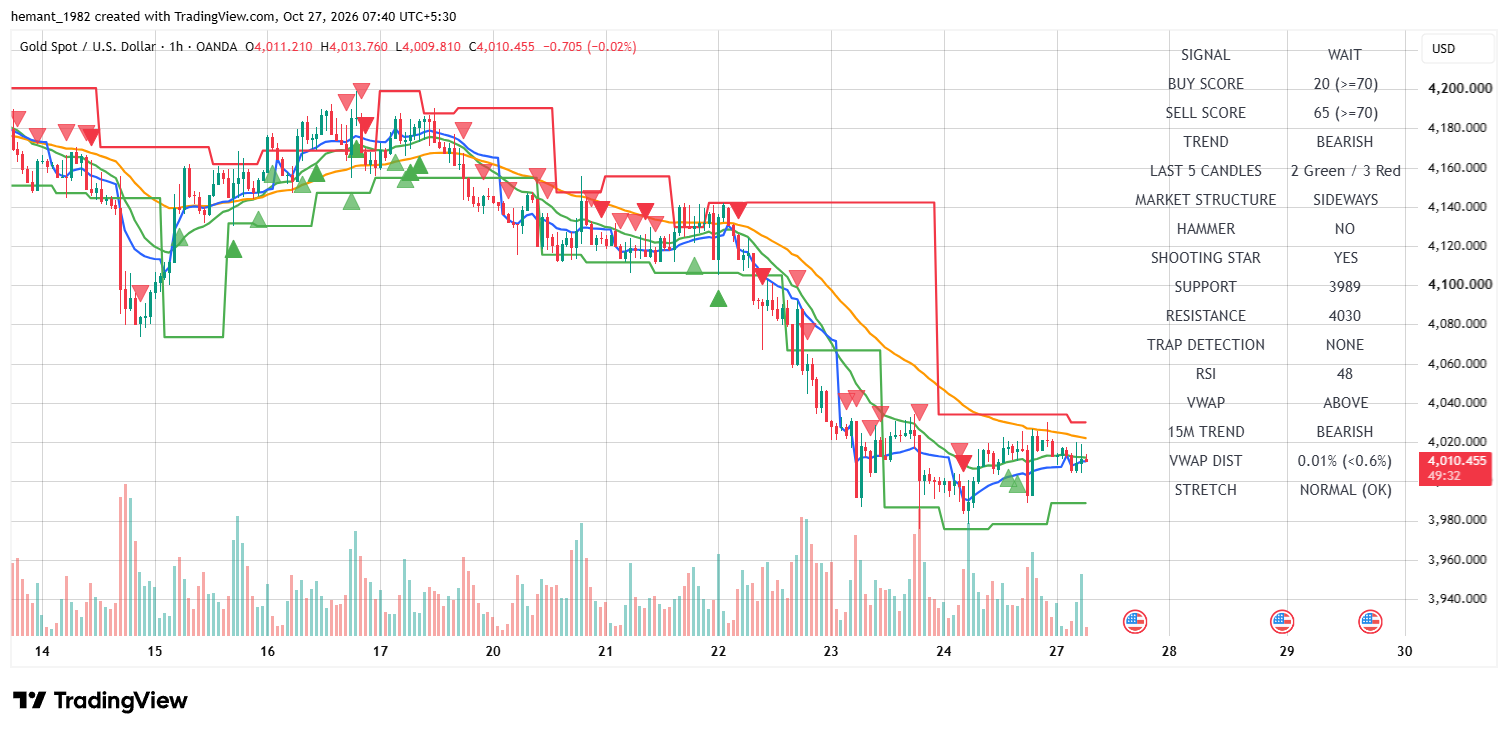
BEARISH
15M
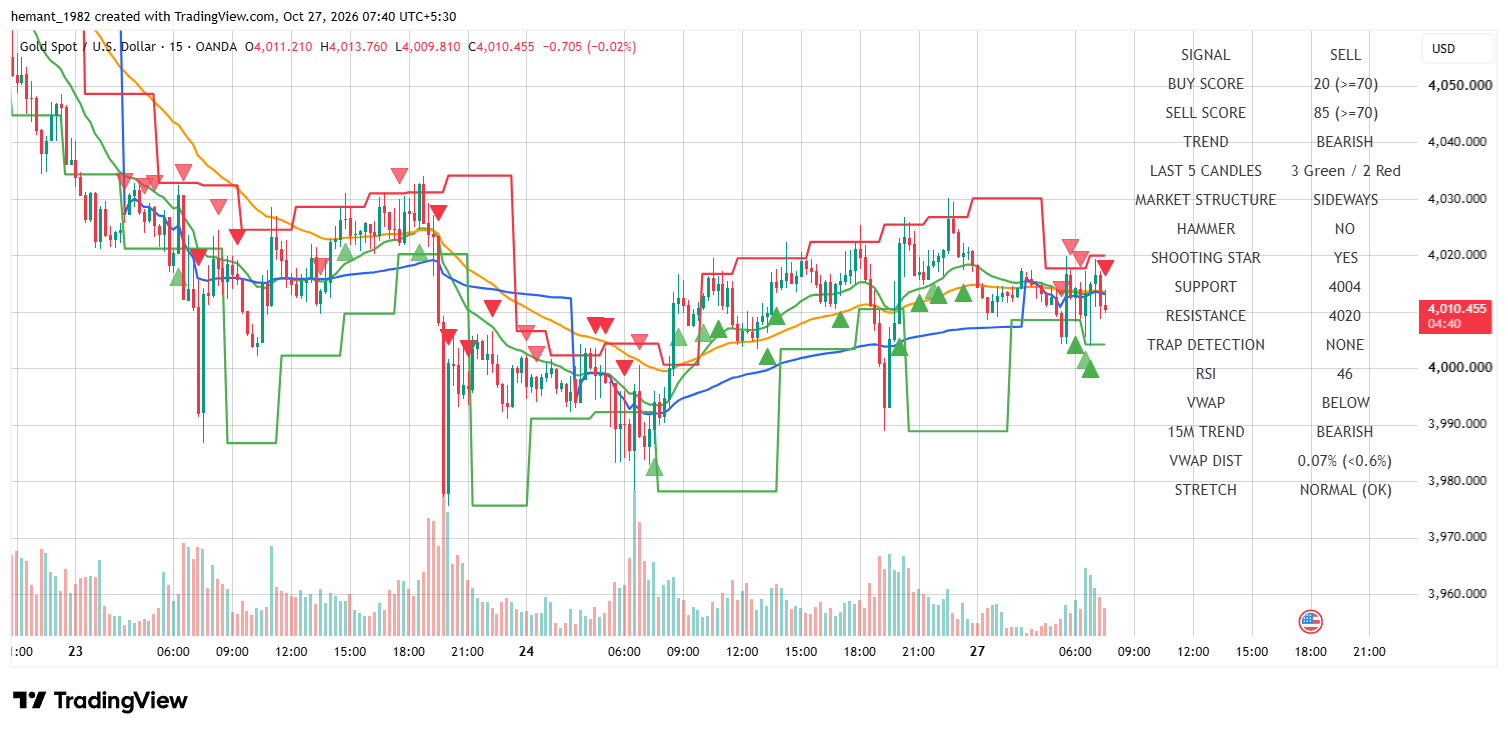
BEARISH
4H RSI
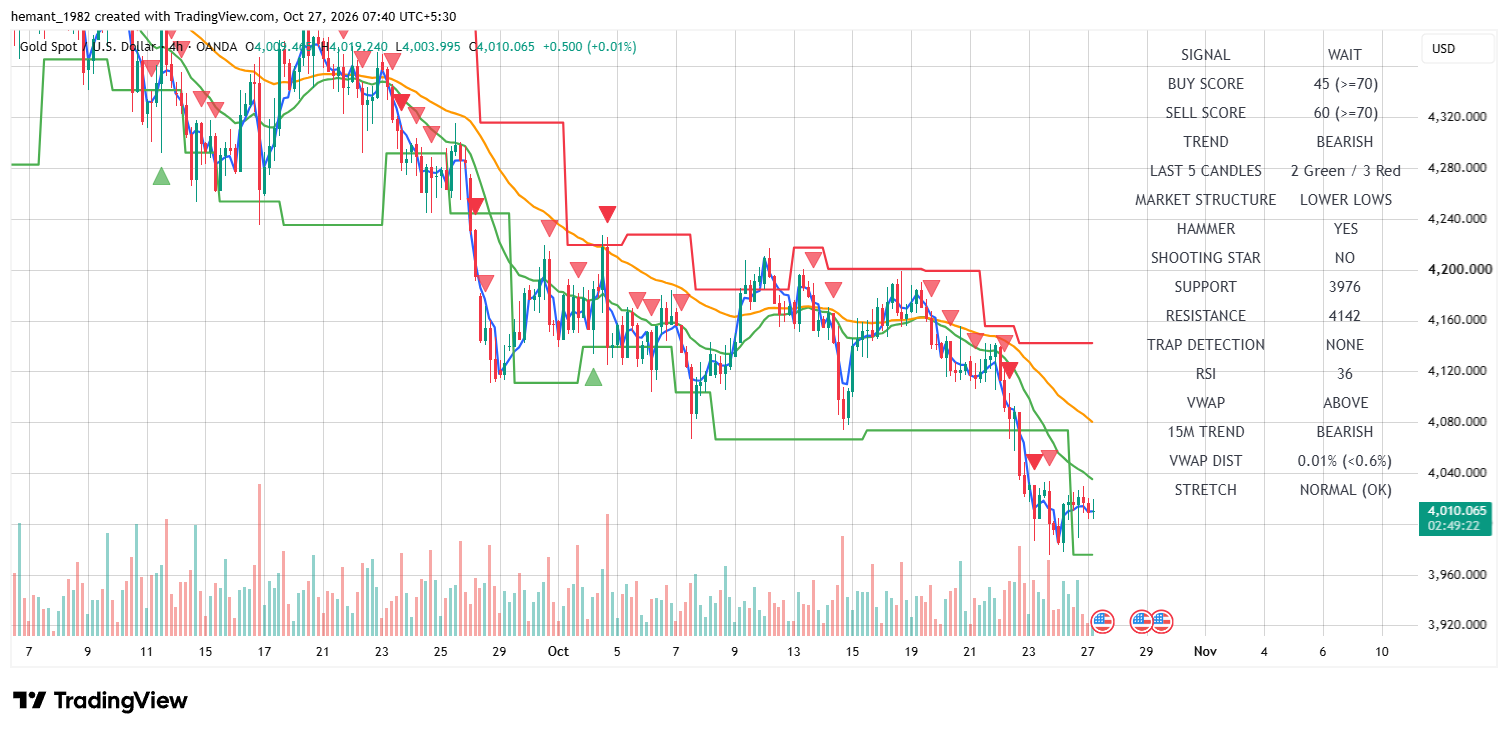
36
Decision Zone
3,976–4,142
Executive Summary
Gold maintains sustained downside pressure across all primary timeframes as market structure prints lower lows on October 27, 2026.
XAUUSD is trading near 4,010.45 amid strong bearish continuation signals.
Structural alignment shows the 4H, 1H, and 15M timeframes locked in a BEARISH posture.
The 4H RSI rests at an oversold level of 36, reflecting persistent downward momentum.
Key structural boundaries are anchored between 3,976 and 4,142 on the 4H frame, while immediate 15M parameters highlight support at 4,004 and resistance at 4,020.
Participants should monitor short-term rejection levels as sellers maintain macro control.
Live trading reference reflecting ongoing session consolidation.
4,020
15M Immediate Resistance
First overhead hurdle for any intraday recovery attempt.
4,142
4H Major Resistance
Macro higher-timeframe resistance ceiling for trend reversal.
06 Scenario Analysis
Bullish Recovery / Relief Bounce
Buyers step in near immediate support to trigger a corrective bounce above the 4,020 level.
Sustained acceptance opens the path toward intermediate resistance near 4,030.
Bearish Continuation
Sellers maintain control below 4,020, extending the breakdown toward deeper support floors near 4,004 and 3,976.
High sell score (85) supports ongoing downside momentum.
Consolidation Range
Price trades sideways in a tight range between support and resistance as market participants await fresh breakout triggers.
Patience is recommended until range boundaries are clearly tested.
07 Trader Decision Framework
Current Bias
Bearish across all primary timeframes (4H, 1H, 15M). Short-term momentum favors selling rallies or riding continuation.
Immediate Zone
4,004–4,020 acts as the primary execution corridor for intraday positioning.
Bullish Trigger
Clean breakout and volume expansion above 4,020 targeting 4,030.
Bearish Trigger
Rejection at 4,020 resistance or clean breakdown below 4,004 support floor.
Risk Condition
High sell score (85) confirms downside pressure, but close proximity to 4,004 support warrants disciplined risk management.
Preferred Approach
Look for short setups on minor intraday rallies toward resistance or monitor support tests near 4,004. Utilize strict stop placements above 4,020.
08 Final Institutional Outlook
XAUUSD exhibits a persistent bearish continuation posture across all timeframes, trading near 4,010.45.
The 4H timeframe maintains a bearish stance (RSI 36),
while the 1H timeframe confirms intermediate downward pressure (RSI 48) and the 15M execution view highlights active selling pressure with support tested near 4,004.
Market participants should monitor key tactical boundaries between 4,004 and 4,020 .
Failure to clear overhead resistance keeps downside pressure active toward major macro targets.
Strict adherence to risk controls and disciplined stop-loss placement remain vital during ongoing trending phases.
Bottom Line
Primary bias: Strongly Bearish (Trend Continuation). Expect continued downside volatility unless price successfully reclaims the 4,020 resistance hurdle.
Risk Disclosure: This analysis is provided for educational and informational purposes only.
It represents a technical interpretation of the charts shown at the time
of publication and should not be considered investment advice, a guarantee
of future price movement, or a recommendation to buy or sell any financial
instrument. Trading leveraged instruments such as gold and CFDs involves
substantial risk. Always apply appropriate position sizing and independent
risk management.
257Active Online
🚀
🔒 Secure Checkout
↗ForexDeviceXAUUSD · Gold Market Intelligence
DAILY XAUUSD MARKET RESEARCH
XAUUSD Gold Analysis, Straight to Your Inbox.
Receive ForexDevice's published XAUUSD technical outlook, key price levels and Morning, London and New York session updates by email.
♢ForexDevice XAUUSD research emails only. Unsubscribe anytime. Your email is stored on this website.
Print your XAUUSD reportChoose your sessions, review the document, then print or save as PDF.
DOCUMENT PREVIEWLatest available session
Your browser's print dialog lets you choose a printer or Save as PDF. No report is published or changed.