FOREXDEVICE โ€ข DAILY MARKET RESEARCH
Analysis Last Updated: 01 October 2026 at 09:03 UTC

XAUUSD Technical Analysis & Structural Outlook
Daily Market Report โ€” 01 October 2026
Multi-Timeframe Confluence โ€ข 4H / 1H / 15M
XAUUSD
4,153.35
4H Bias
BEARISH
1H Bias
BEARISH
15M
BEARISH
4H RSI
44
Decision Zone
4,110โ€“4,170
Gold exhibits sustained downside pressure across multi-timeframe structures following distribution breakdowns on October 1, 2026.
XAUUSD is trading around 4,153.35 amid active downward continuation. Structural alignment shows the 4H, 1H, and 15M timeframes printing BEARISH continuation signals as sellers defend overhead resistance levels. The 4H RSI rests at 44, reflecting persistent downward momentum.
On the execution front, immediate structural boundaries are anchored between 4,110 and 4,170 on the 4H frame, while immediate 15M parameters highlight support at 4,139 and resistance at 4,165. Participants should monitor these reaction zones carefully as short-term rallies face renewed selling pressure.
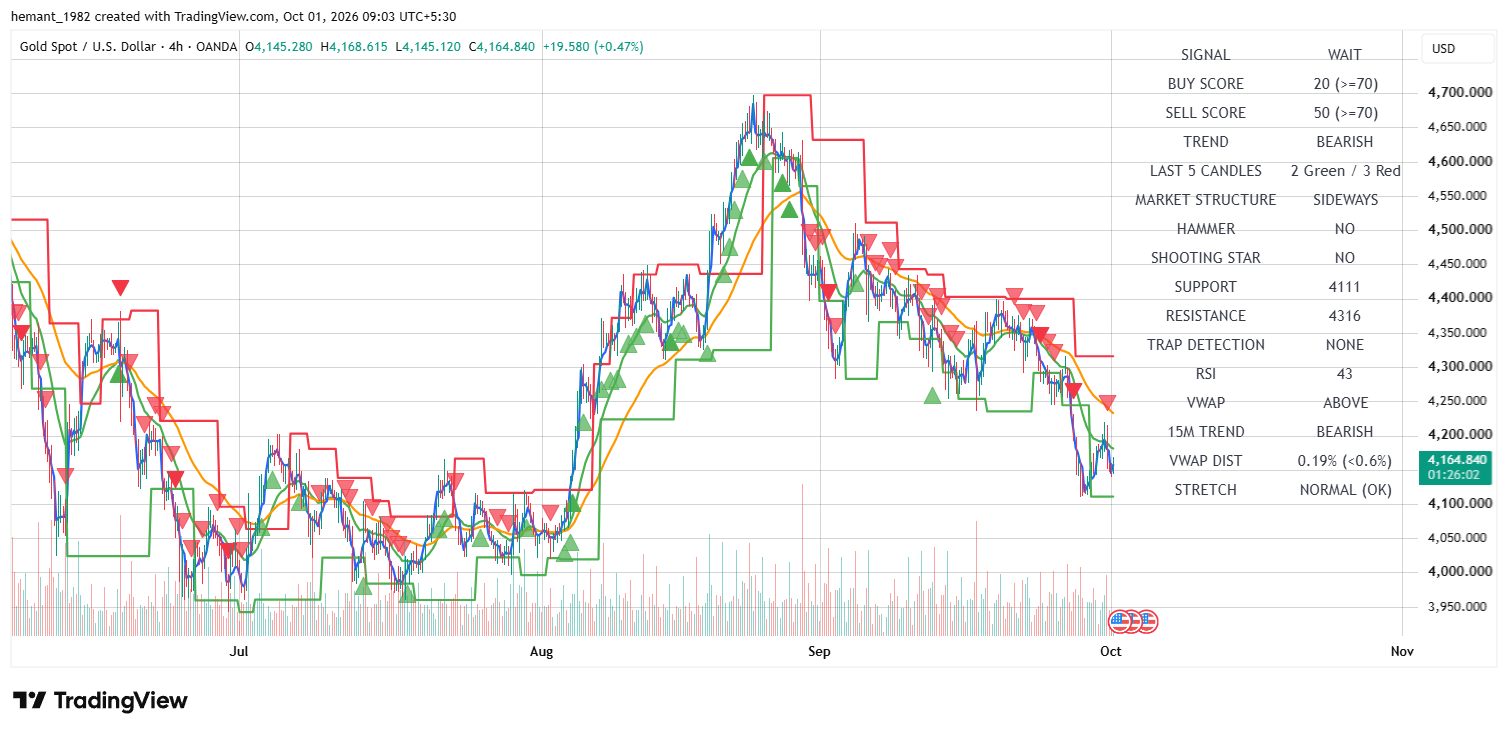
XAUUSD 4 Hour Technical Analysis โ€” 01 October 2026
XAUUSD 4H โ€” Higher-timeframe macro breakdown and downward pressure near key support floors
Market Structure โ€” At a Glance
Primary Trend
Bearish Across Timeframes
4H Momentum
Downward Expansion
1H Structure
Bearish Pressure
15M Structure
Bearish Continuation
Immediate Support
4,110
Immediate Resistance
4,170
Major Resistance
4,170
Preferred State
Tactical Sell / Trend Following

01 Multi-Timeframe Structural Assessment

Cross-timeframe alignment displays a unified bearish posture: 15M bearish continuation โ†’ 1H bearish structure โ†’ 4H macro downward trend.

Price action reflects active seller dominance at overhead resistance levels, pushing momentum metrics into negative territory across all horizons.

With the 4H RSI dipping to 44, selling momentum is active, leaving room for potential tests of deeper macro support floors.

Traders should manage risk carefully around support barriers where temporary buyer defenses may form.

02 4H Institutional View

Trend
Bearish
RSI
44
Market Structure
Lower Lows
VWAP
Below
Support
4,110
Resistance
4,170

The 4H timeframe outlines the macro structural picture, with XAUUSD trading near 4,153.35 under a BEARISH trend classification.

The 4H RSI reads 44, reflecting ongoing downward selling pressure. Sell score registers high relative to buying interest.

Structural support is established near 4,110, while macro resistance ceiling is pinned at 4,170.

Sustained trade below local moving averages confirms the broader downside bias.

4H Assessment
Macro trend remains firmly bearish, with RSI at 44 and consistent lower lows pointing to further downside potential.

03 1H Tactical Structure

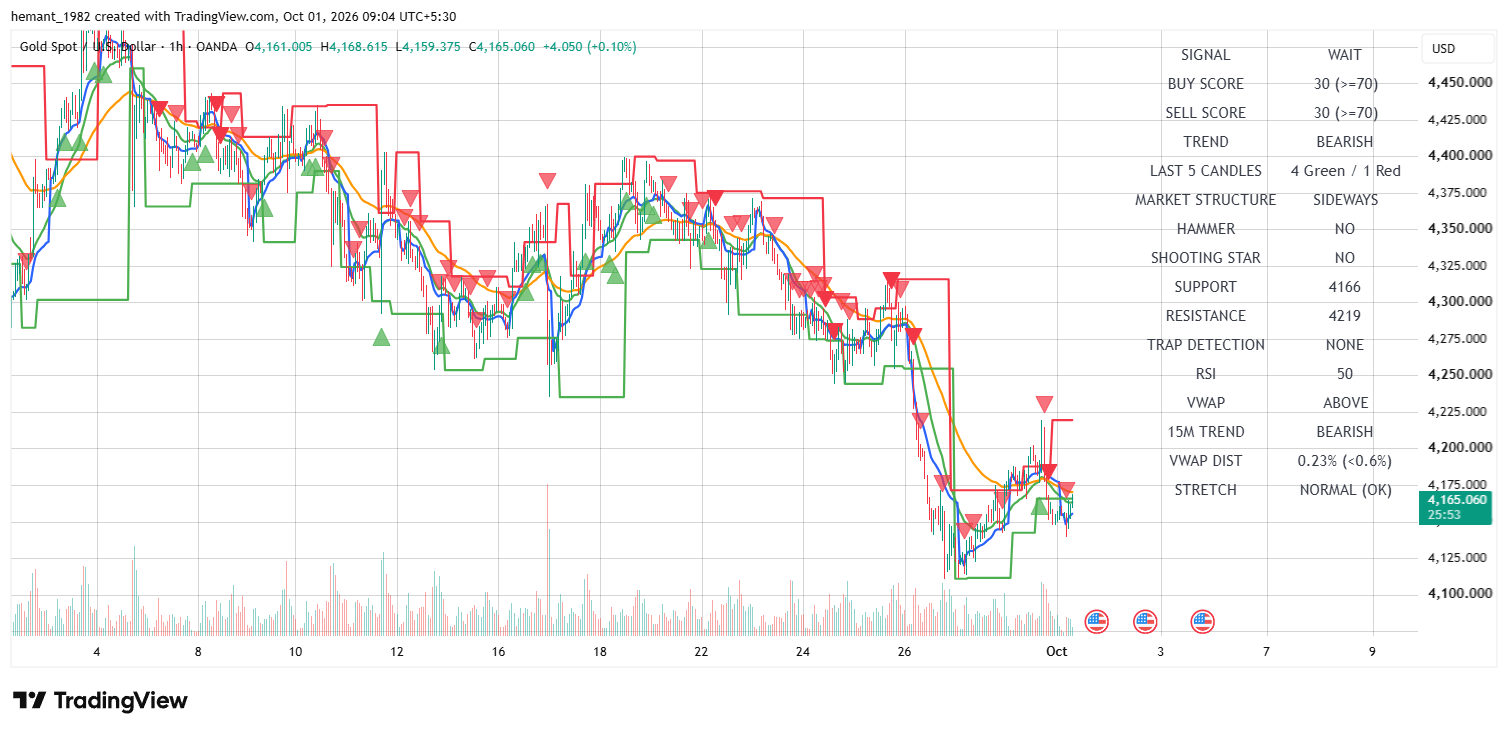
XAUUSD 1 Hour Technical Analysis โ€” 01 October 2026
XAUUSD 1H โ€” Intermediate trend breakdown and downward momentum expansion
Trend
Bearish
RSI
42
Recent Candles
2 Green / 3 Red
VWAP
Below
Support
4,139
Resistance
4,165

The 1H chart holds a BEARISH trend label, with the RSI printing at 42.

Recent candle structure reflects seller dominance, highlighting steady intermediate weakness.

Immediate 1H support is marked at 4,139, while tactical overhead resistance stands near 4,165.

Maintaining position below resistance preserves the active downward setup.

1H Assessment
Bearish intermediate trend structure confirmed with RSI at 42. Price action trades consistently below key VWAP parameters.

04 15M Execution View

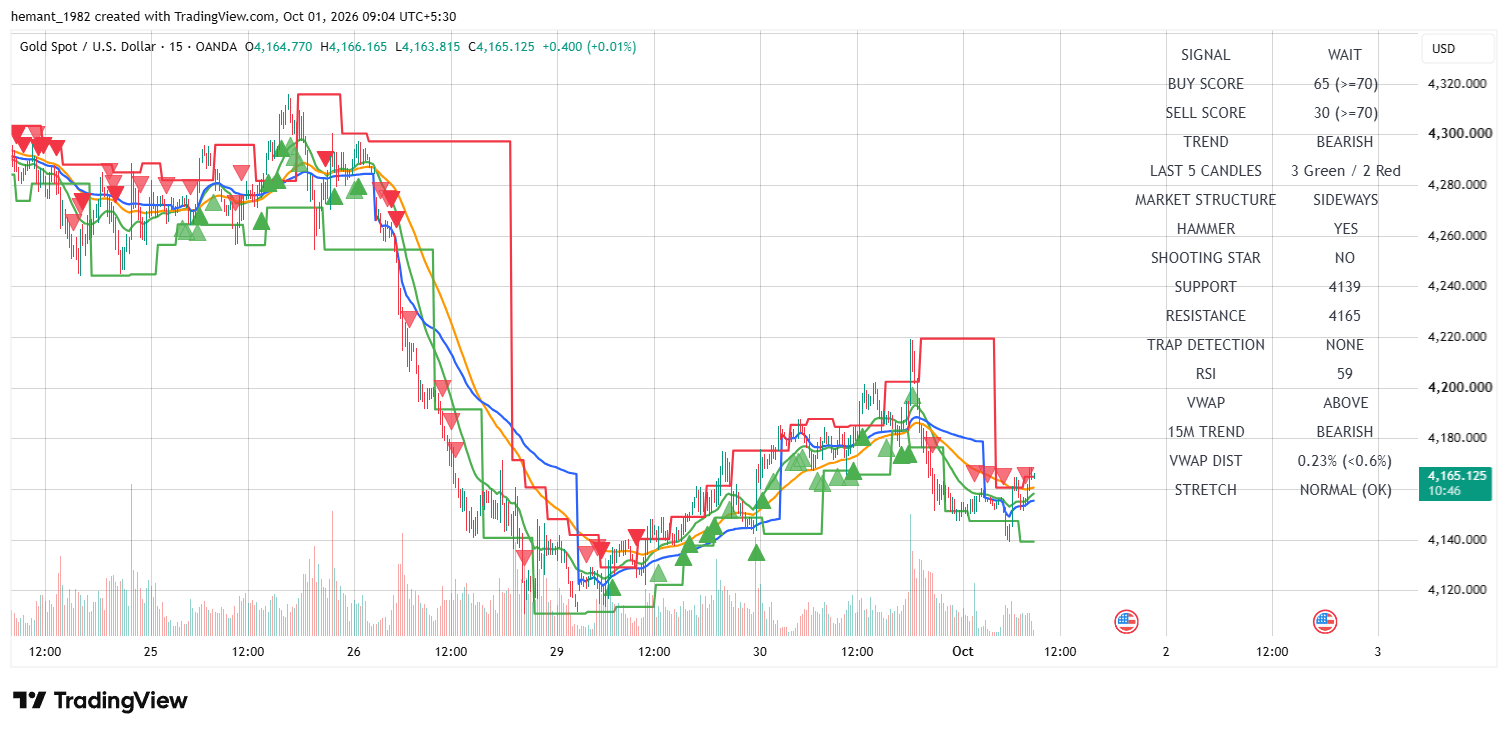
XAUUSD 15 Minute Technical Analysis โ€” 01 October 2026
XAUUSD 15M โ€” Short-term execution triggers, sell scores, and downward progression
Trend
Bearish
RSI
39
Buy Score
25
Sell Score
85
Support
4,139
Resistance
4,165

The 15M execution timeframe registers a strong BEARISH trend condition with a Sell Score of 85 and a Buy Score of 25.

The RSI points lower to 39, reflecting robust short-term selling momentum.

The immediate tactical corridor is bounded by support at 4,139 and resistance at 4,165. Price is trading live near 4,153.35.

Holding below 4,165 confirms continued downward momentum, whereas a breakdown would target 4,110 support.

15M Assessment
Strong short-term bearish bias with an elevated Sell Score of 85 and RSI at 39. Momentum favors continued downside extension.

05 Key Price Levels & Market Map

LevelRoleTechnical Interpretation
4,1104H Major Support Base Macro floor establishing long-term structural defense against deeper correction.
4,1391H/15M Support Level Critical intermediate baseline supporting current intraday price action.
4,153.35Current Market Price Live trading reference evaluating immediate session weakness.
4,16515M Immediate Resistance Immediate overhead hurdle limiting short-term bounce attempts.
4,1704H Major Resistance Macro higher-timeframe resistance ceiling capping bearish continuation structure.

06 Scenario Analysis

Bearish Continuation
Sellers maintain control below the 4,165 level, expanding downward momentum toward lower macro targets. Sustained acceptance opens the path toward macro support near 4,110.
Bullish Reversal / Relief Bounce
Support near 4,139 holds firm, triggering short-covering and a rebound toward the 4,165 overhead resistance. A clean breach of 4,165 challenges the broader bearish bias.
Consolidation Range
Price pauses its decline to stabilize in a tighter channel as market participants digest recent downward structural shifts. Patience is recommended until range boundaries are tested.

07 Trader Decision Framework

Current Bias
Bearish across short-term horizons and 4H macro structures. Momentum favors selling rallies.
Immediate Zone
4,139โ€“4,165 acts as the primary execution corridor for intraday positioning.
Bearish Trigger
Continuation below 4,153 with volume expansion targeting 4,110.
Bullish Trigger
Rejection at current lows or clean breakout above 4,165 resistance ceiling.
Risk Condition
Oversold RSI levels (39โ€“42) warrant caution against chasing extended moves into macro support zones.
Preferred Approach
Trade short setups off tactical rallies or ride downward momentum with trailing stops. Utilize strict stop placements above 4,165 resistance.

08 Final Institutional Outlook

XAUUSD exhibits a sustained downward continuation posture across structural timeframes, trading near 4,153.35. The 4H timeframe maintains a bearish stance (RSI 44), while the 1H timeframe confirms intermediate weakness (RSI 42) and the 15M execution view displays active selling momentum with a strong sell score of 85 and RSI at 39.

Market participants should monitor key tactical boundaries between 4,139 and 4,165 . Holding below these resistances keeps downward continuation active toward macro support ceilings.

Strict adherence to risk controls and disciplined stop-loss placement remain vital during active trend phases.

Bottom Line
Primary bias: Moderately Bearish (Trend Continuation). Expect continued downside pressure as long as price remains below the 4,165 resistance ceiling.
Risk Disclosure: This analysis is provided for educational and informational purposes only. It represents a technical interpretation of the charts shown at the time of publication and should not be considered investment advice, a guarantee of future price movement, or a recommendation to buy or sell any financial instrument. Trading leveraged instruments such as gold and CFDs involves substantial risk. Always apply appropriate position sizing and independent risk management.

๐Ÿ’ฌ XAUUSD TRADER DISCUSSIONS

Real-time execution setups & analysis
โš ๏ธ You must log in to post here...
Per page:
๐Ÿ‡บ๐Ÿ‡ธ Sam
2026-10-14 01:43:45
โ•”โ•โ•โ•โ•โ•โ•โ•โ•โ•โ•โ•โ•โ•โ•โ•โ•โ•โ•โ•โ•โ•โ•โ•โ•โ•โ•โ•โ•โ•โ•โ•โ•โ•โ•โ•โ•โ•โ•โ•โ•โ•โ•โ•โ•โ•โ•โ•โ•โ•โ•โ•โ•โ•โ•โ•โ•โ•โ•โ•โ•โ•โ•โ•โ•โ•โ•— โ•‘ 🎯 TRADER'S DAILY NOTES: XAUUSDย  ย  ย  ย  ย  ย  ย  ย  ย  ย  ย  ย  ย  ย  ย  ย  ย  ย  ย  ย  ย  ย  ย  ย  ย  ย  ย  ย  ย  ย  ย  ย  ย  ย  ย  ย  ย  ย  ย  ย  ย  ย  ย  ย  ย  ย  ย  ย  ย  ย  โ•‘ โ•‘ 📅 Date: 14 October 2026 | 07:01 UTCย  ย  ย  ย  ย  ย  ย  ย  ย  ย  ย  ย  ย  ย  ย  ย  ย  ย  ย  ย  ย  ย  ย  ย  ย  ย  ย  ย  ย  ย  ย  ย  ย  ย  ย  ย  ย  ย  ย  ย  ย  ย  ย  ย  ย  ย  ย  ย  ย  ย  ย  ย โ•‘ โ•šโ•โ•โ•โ•โ•โ•โ•โ•โ•โ•โ•โ•โ•โ•โ•โ•โ•โ•โ•โ•โ•โ•โ•โ•โ•โ•โ•โ•โ•โ•โ•โ•โ•โ•โ•โ•โ•โ•โ•โ•โ•โ•โ•โ•โ•โ•โ•โ•โ•โ•โ•โ•โ•โ•โ•โ•โ•โ•โ•โ•โ•โ•โ•โ•โ•โ• [1] 📊 MARKET SNAPSHOT & BIAS ------------------------------------------------------------------- โ€ข Asset / Pair : 🪙 XAUUSD (Gold / US Dollar) โ€ข Live Reference : 💵 4,163.43 โ€ข Primary Macro Bias : 🐻 BEARISH (4H Frame) โ€ข Intermediate Bias : 📉 BEARISH (1H Frame) โ€ข Intraday Execution : ⚡ BEARISH (15M Frame) โ€ข 4H RSI : ⚖️ 50 (Neutral Consolidation) โ€ข Key Decision Zone : 🛡️ 4,067 โ€“ 4,201 [2] 🌐 MULTI-TIMEFRAME ALIGNMENT ------------------------------------------------------------------- โ€ข 4H Horizon : 🔻 Bearish trend, sideways market structure. Buy Score: 20 | Sell Score: 40. โ€ข 1H Horizon : 🌊 Bearish consolidation, RSI at 46. Trading below key overhead resistance. โ€ข 15M Horizon : ⏱️ Bearish short-term, RSI at 55. Buy Score: 30 | Sell Score: 65. [3] 🔑 KEY PRICE LEVELS ------------------------------------------------------------------- โ€ข Major Resistance : 🧱 4,201 (4H / 1H Macro Ceiling) โ€ข Intraday Resistance : 🚧 4,167 (15M Immediate Overhead) โ€ข Live Price : 🪙 4,163.43 โ€ข Immediate Support : 🛋️ 4,158 (15M Short-term Floor) โ€ข Intermediate Sup. : 🪜 4,147 (1H Support) โ€ข Major Support Base : 🏛️ 4,067 (4H Macro Structural Floor) [4] 📈 SCENARIO ANALYSIS ------------------------------------------------------------------- โ€ข BEARISH CONTINUATION (🎯 Preferred Setup) -> Overhead resistance holds firm below 4,167. -> Break below 4,158 targets 4,147 and major 4,067 floor. โ€ข BULLISH REBOUND / BREAKOUT (🔄 Alternative) -> Buyers reclaim and sustain price above 4,167. -> Upside expansion toward 4,201 macro resistance ceiling. โ€ข CONSOLIDATION RANGE (⏸️ Neutral) -> Range-bound chop between 4,158 and 4,167. -> Wait for clear edge test/breakout trigger before entering. [5] 🛠️ TRADER EXECUTION FRAMEWORK ------------------------------------------------------------------- โ€ข Primary Direction : 📉 Short setups on rallies / Breakdowns on volume โ€ข Execution Zone : 🎯 4,158 โ€“ 4,167 corridor โ€ข Invalidation / SL : 🛑 Strict stop-loss placement above 4,167 โ€ข Risk Note : ⚠️ Sideways structure + neutral 4H RSI (50) require strict position sizing and patience. =================================================================== 🔗 Source: https://forexdevice.com/xauusd-technical-analysis-14-october-2026/ ===================================================================
0 0
๐Ÿ‡บ๐Ÿ‡ธ Sam
2026-10-13 02:26:13
🟡 XAUUSD Institutional Market Report & Technical Analysis โ€” October 13, 2026 ============================================================== Live Price Reference: 4,169.16 USD Overall Market Bias: Mixed / Cautious Consolidation 📊 Multi-Timeframe Structure & Bias โ€ข 4H Macro Trend: Bearish (RSI: 52 | Market Structure: Sideways) โ€ข 1H Tactical Trend: Bullish (RSI: 47 | VWAP: Above) โ€ข 15M Execution View: Bearish / Neutral (Buy/Sell Score: 40/40) 🔑 Key Price Levels to Watch โ€ข 4H Macro Resistance Ceiling: 4,217 โ€ข 15M Immediate Resistance Hurdle: 4,176 โ€ข Current Market Price: 4,169.16 โ€ข 15M Immediate Support Floor: 4,163 โ€ข 1H Support Baseline: 4,155 โ€ข 4H Major Support Base: 4,067 💡 Trader Decision Framework & Outlook โ€ข Market Condition: Gold is currently trading in a tight consolidation corridor between lower-timeframe support and overhead resistance as market participants weigh short-term recovery attempts against macro bearish pressure. โ€ข Bullish Trigger: Clean breakout and acceptance above 4,176 to open the path toward the macro 4,217 ceiling. โ€ข Bearish Trigger: A breakdown below execution support at 4,163 and the 4,155 baseline. โ€ข Preferred Approach: Exercise patience, trade range boundaries, or wait for confirmed breakout triggers with strict risk management. 🔗 Read the complete detailed report & charts here: https://forexdevice.com/xauusd-technical-analysis-13-october-2026/ #XAUUSD #GoldTrading #TechnicalAnalysis #ForexSignals #TradingView #MarketUpdate #ForexDevice
3 0
๐Ÿ‡บ๐Ÿ‡ธ Sam
2026-10-12 14:29:53
============================================= [FORUM POST] XAUUSD Technical Outlook & Key Levels ============================================= Hey Community, Here is the latest intraday breakdown for XAUUSD (Gold) on the M15 chart. Price is currently consolidating after reaching recent highs. ----------------------------------------------- 1. CURRENT MARKET CONTEXT ----------------------------------------------- โ€ข Current Price : ~4165.35 โ€ข Timeframe : M15 (15-Minute) โ€ข Trend State : Intraday Pullback / Short-Term Bearish Correction โ€ข Context : Price rejected off top resistance near 4218.50 and is now testing local demand levels. -------------------------------------------------------- 2. KEY TECHNICAL LEVELS TO WATCH -------------------------------------------------------- [RESISTANCE ZONES] โ€ข R3: 4218.50 (Recent High / Major Resistance) โ€ข R2: 4202.30 (Breakout Pivot) โ€ข R1: 4186.10 (Immediate Overhead Resistance) [SUPPORT ZONES] โ€ข Current Level: ~4165.35 โ€ข S1: 4161.70 (Immediate Intraday Support) โ€ข S2: 4145.50 (Key Liquidity Zone) โ€ข S3: 4129.30 (Lower Demand Support) -------------------------------------------------- 3. POTENTIAL TRADE SCENARIOS -------------------------------------------------- [BULLISH CONTINUATION] โ€ข Needs a clear reclamation and candle close above 4186.10. โ€ข Target 1: 4202.30 โ€ข Target 2: 4218.50 [BEARISH BREAKDOWN] โ€ข A sustained break below 4161.70 opens downside momentum. โ€ข Target 1: 4145.50 โ€ข Target 2: 4129.30 -------------------------------------------------------------------------------- 4. ENGINE VOLATILITY & METRICS (GoldPulse PRO) -------------------------------------------------------------------------------- โ€ข Dynamic Breakout Range : 178.1 pips (High Intraday Volatility) โ€ข Trailing Activation : 100.0 pips โ€ข Trail Lock Distance : 80.0 pips -------------------------------------------------------------------------------- What are your targets for Gold today? Are you looking for a bounce at 4161 or waiting for a deeper dip? Drop your thoughts below!
0 0
๐Ÿ‡บ๐Ÿ‡ธ Sam
2026-10-12 01:34:35
XAUUSD Update: Navigating the Golden Recovery Gold is flashing interesting signals today. While the higher 4H macro chart still carries a bearish filter, lower timeframes (1H & 15M) are showing strong tactical bullish continuation. Current Market Standing: Live Price Action: Trading around $4,208.67 15M Buy Score: Strong at 80 (with an RSI of 64) Key Intraday Zone: Watch the $4,169 โ€“ $4,202 corridor for immediate execution setups. Are you riding the short-term long momentum or waiting for a macro pullback? Check out the full breakdown, complete with multi-timeframe indicator strips, key price levels, and our complete trader decision framework. Read the full report here: https://forexdevice.com/xauusd-technical-analysis-october-12-2026/
0 0
๐Ÿ‡บ๐Ÿ‡ธ Sam
2026-10-10 02:33:06
Saturday Confessions: What does your trading brain do when XAUUSD is frozen? 📊☕ ================================================================== Hey Knowledge Pulse Community! Happy Saturday! As we all know, itโ€™s the weekend, the charts are frozen, and XAUUSD is securely locked at Fridayโ€™s close. In theory, this is the time weโ€™re supposed to step away, relax, and pretend we have normal non-financial hobbies. In reality? If youโ€™re anything like me, your thumb has probably opened TradingView or MetaTrader at least 5 times today just out of pure muscle memory. 😅 I just published a fun article on the main site diving into the "5 Stages of Weekend Chart Withdrawal" and how traders transition from phantom tick syndrome to weekend strategy planning: 👉 Read the full article here: https://theknowledgepulse.com/weekend-traders-life-market-closed/ -------------------------------------------------------------------------------- 🔥 QUICK COMMUNITY POLL: What is your typical weekend trading habit? [ ] Option A: Total Disconnect โ€” I close all trading apps until Sunday night. [ ] Option B: The Analyst โ€” I spend hours drawing high-timeframe zones & backtesting. [ ] Option C: Crypto Relapse โ€” I stare at BTC/ETH charts just to see something move. [ ] Option D: The Phantom Tap โ€” I constantly refresh closed charts out of habit. -------------------------------------------------------------------------------- 💬 DISCUSSION STARTERS: 1. Whatโ€™s the most "trader brain" thing youโ€™ve caught yourself doing in real life over a weekend? (e.g., converting coffee prices into pip values or mapping traffic jams as consolidation zones?) 2. Do you carry open XAUUSD positions into the weekend, or do you always close out on Friday to avoid opening gap risk? Drop your vote and letโ€™s hear your weekend thoughts below! 👇
1 0
๐Ÿ‡บ๐Ÿ‡ธ Sam
2026-10-09 12:32:49
================================================== 📌 XAUUSD TRADER'S CHEAT SHEET: A Guide to Consistency ================================================== Fellow Traders, Gold moves fast, respects no one, and rewards discipline. If you want to survive and thrive on XAUUSD, here is your core framework to keep on your desk. 📈✨ -------------------------------------------------- 1. THE GOLDEN RULES OF RISK MANAGEMENT -------------------------------------------------- โ€ข Max Risk per Trade: 1% to 2% max (no exceptions). โ€ข Spread Awareness: Always factor in London/NY session spreads. โ€ข Stop Loss: Never trade Gold without one. Period. 🛑 -------------------------------------------------- 2. MASTERING THE SESSIONS -------------------------------------------------- โ€ข London Open (08:00 UTC): Initial liquidity sweeps. Watch for fakeouts. โ€ข New York Open (13:30 UTC): Where the massive trends or reversals happen. โ€ข Avoid: Low liquidity hours during Asian session consolidation unless scalping tight ranges. 🕒 -------------------------------------------------- 3. PSYCHOLOGY CHECKLIST -------------------------------------------------- โ€ข Revenge Trading: Closed a loss? Walk away for 30 minutes. Gold will still be here. โ€ข FOMO: Chasing a runaway green candle is a quick way to donate margin. 🧘‍♂️ โ€ข Journaling: Log every setupโ€”mistakes are just tuition fees. -------------------------------------------------- Drop your thoughts below. What is your go-to timeframe for trading XAUUSD? Let's discuss! 👇🔥 ==================================================
1 0
๐Ÿ‡บ๐Ÿ‡ธ Sam
2026-10-09 10:44:19
🚀ย GoldPulse Pro Engine in Action: XAUUSD M15 Live Setup & Performance Breakdown! Hey Traders, If you have been tracking gold volatility lately, you know how crucial it is to catch clean momentum shifts without getting chopped up by sudden fakeouts. Check out our latest snapshot running the GoldPulse Pro Engine on the XAUUSD M15 timeframe (IC Markets MT4). The system has been actively managing breakout zones and locking in gains with its built-in trailing engine. Quick Strategy Specs: Asset: XAUUSD Timeframe: M15 Engine Status: Active Demo / Backtest Setup Risk & Trailing Management: Dynamic Lot Sizing (0.41 - 0.95), 350-pip Stop Loss Protection, and a responsive Trailing Engine activated at 100 pips to lock in profits securely. Clean execution and solid risk parameters are everything when trading precious metals. Want to check out the live charts, deeper technical analysis, and grab the full breakdown? Visit our trading desk here:ย  https://forexdevice.com/xauusd-pro-trading-desk/ย  Letโ€™s discuss belowโ€”how are you currently trading XAUUSD this week? Drop your thoughts or questions in the comments!
1 0
๐Ÿ‡บ๐Ÿ‡ธ Sam
2026-10-09 01:53:21
XAUUSD Technical Outlook โ€” October 9, 2026

Price: $4,171.40
Bias: Short-Term Bullish (Lower TF) / Bearish (4H Macro)

Key Levels:
โ€ข Resistance: 4,146 / 4,184
โ€ข Support: 4,121 / 4,106

Quick Strategy:
Short-term momentum favors buying dips while price holds above the 4,106โ€“4,121 support zone, targeting a push toward 4,184. Watch out for overextended RSI.

Full report: https://forexdevice.com/xauusd-technical-analysis-09-october-2026/
1 0
๐Ÿ‡บ๐Ÿ‡ธ Sam
2026-10-08 13:12:02
XAU/USD (Gold) 15-Minute Technical Analysis & Trade Setup

Hello community! Here is the latest breakdown for XAU/USD based on current 15M market structure and momentum indicators. 

Market Overview:
โ€ข Current Price: 4,124.03
โ€ข Trend: Bullish / Sideways Consolidation
โ€ข RSI: 51 (Neutral)
โ€ข VWAP: Above

Actionable Trade Setups:

Setup 1: Bullish Bounce (Long)
โ€ข Entry Zone: 4,118.00 - 4,122.00 (On minor dip to support)
โ€ข Stop Loss (SL): 4,108.00
โ€ข Take Profit (TP1): 4,133.00
โ€ข Take Profit (TP2): 4,145.00

Setup 2: Bearish Breakdown (Short)
โ€ข Entry Zone: Bearish close below 4,110.00
โ€ข Stop Loss (SL): 4,118.00
โ€ข Take Profit (TP): 4,098.00 - 4,100.00

Community Discussion: Are you playing the range breakout or waiting for a deeper pullback to support? Drop your thoughts below!
1 0
๐Ÿ‡ฟ๐Ÿ‡ฆ Tshegofatso
2026-10-08 06:16:50
Since my view on gold high timeframe is bearish,the market sweeped 4140 is the continuation to the upside to grab all the left liquidity to fuel gold to drop even further?
2 0
โ†ณ ๐Ÿ‡บ๐Ÿ‡ธ Sam
2026-10-08 06:22:26
Spot on! I totally agree with your higher timeframe bearish view. That push and sweep near 4,140 looks like a classic liquidity grabโ€”taking out resting stops to fuel the next leg down. Right now, with gold pulling back down around 4,118, it's all about watching that immediate support. If sellers keep the pressure on and break this floor, we're likely heading lower.
1 0
โ†ณ ๐Ÿ‡ฟ๐Ÿ‡ฆ Tshegofatso
2026-10-08 07:01:24
If price break below 4,118 we looking for sells?
0 0
โ†ณ ๐Ÿ‡บ๐Ÿ‡ธ Sam
2026-10-08 07:17:05
Exactly! If it breaks and holds below that 4,118โ€“4,120 floor, that's the green light for short setups. Just waiting for a clean confirmation candle close underneath so we don't get faked out by a minor wick. Let's see how it plays out!
1 0
...