XAUUSD Technical Analysis & Structural Outlook
01 Multi-Timeframe Structural Assessment
The cross-timeframe alignment reflects active buyer commitment: 15M bullish impulse → 1H bullish continuation → 4H sideways accumulation.
Price action demonstrates sustained resilience, defending lower boundaries and building higher lows across intermediate horizons. This demonstrates that short-term market participants are actively absorbing selling pressure.
While the 4H template continues to consolidate within broader structural ranges, a stable RSI of 57 ensures that the market maintains healthy upside potential without immediate exhaustion risks.
The disciplined approach for participants is to track reaction points at immediate support boundaries rather than chasing market extensions aggressively.
02 4H Institutional View
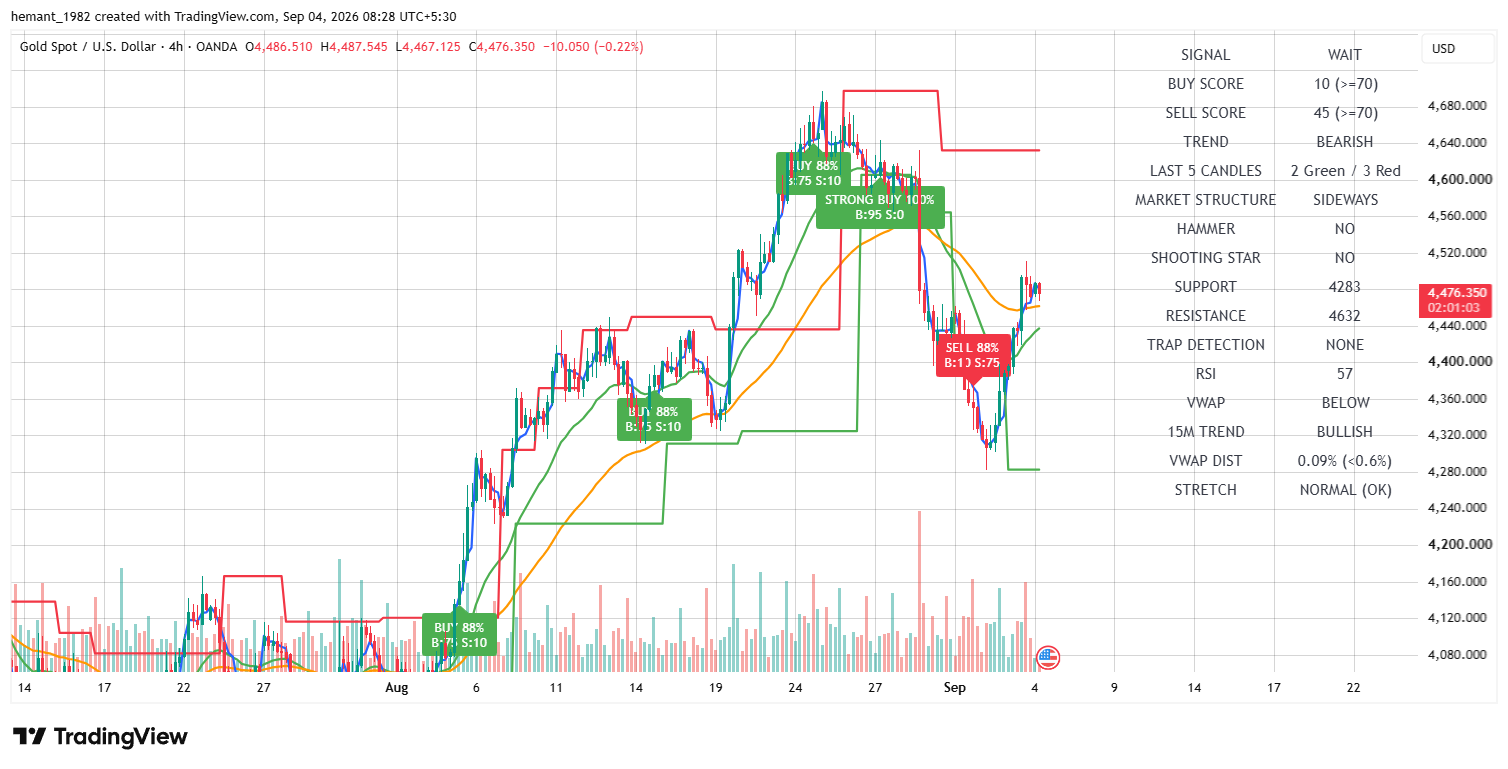
The 4H timeframe maps out the broader structural environment, with XAUUSD consolidating near 4,476.35.
The 4H RSI rests comfortably at 57, signaling balanced momentum conditions capable of supporting sustained directional movement.
Structural support is established around 4,283, while overhead macro resistance remains anchored near 4,632. Price is currently probing the upper boundaries of its recent recovery channel.
Continued stability above mid-range pivots will reinforce confidence in ongoing bullish continuation models across higher timeframes.
03 1H Tactical Structure
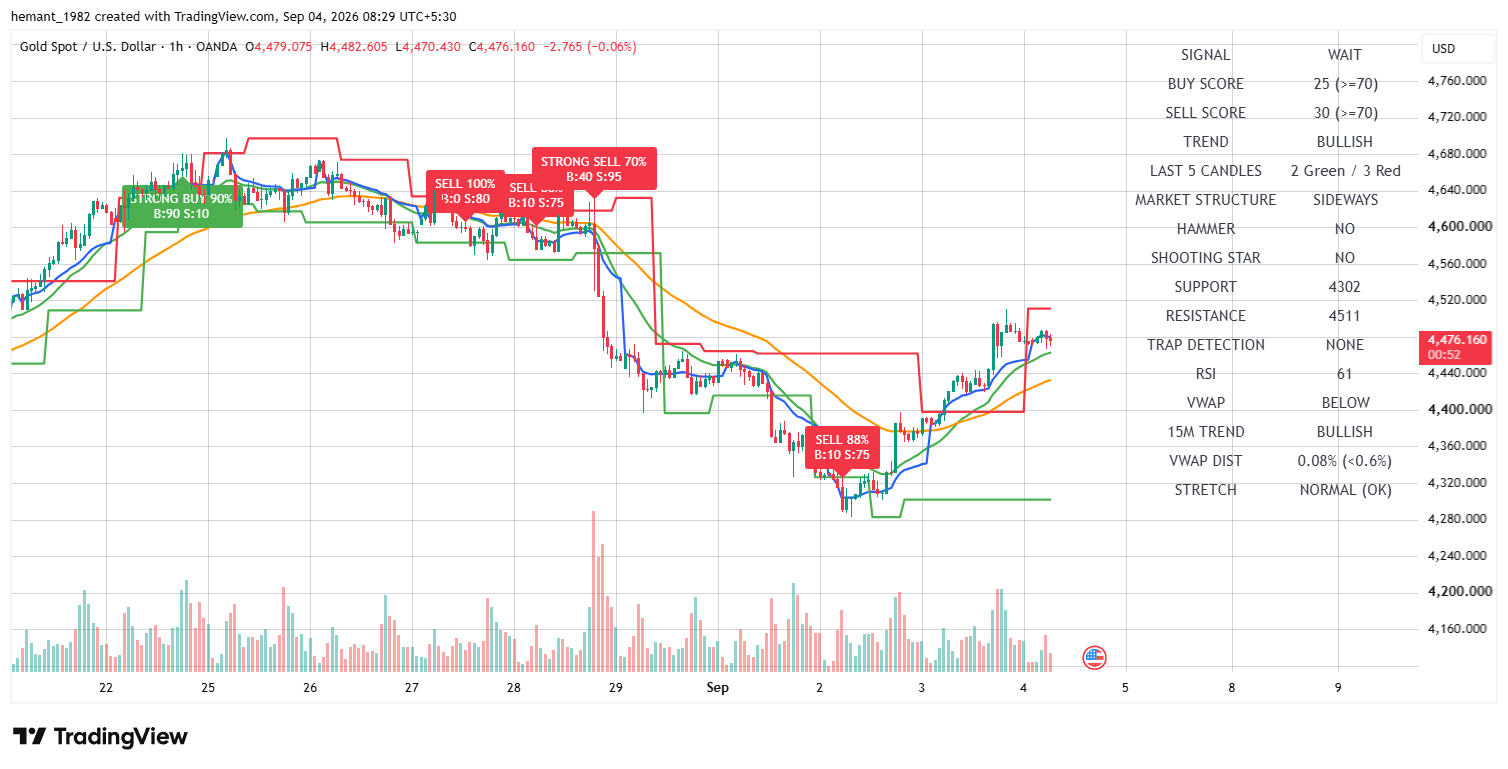
The 1H chart reflects a solid BULLISH trend condition, with price holding firmly above the VWAP indicator.
The RSI stands at a healthy 61, indicating steady buying pressure without extreme overextension risks.
Immediate support is pegged at 4,302, while tactical overhead resistance is situated near 4,511.
The orderly cadence of recent candles highlights controlled accumulation, providing a stable platform for intraday continuation setups.
04 15M Execution View
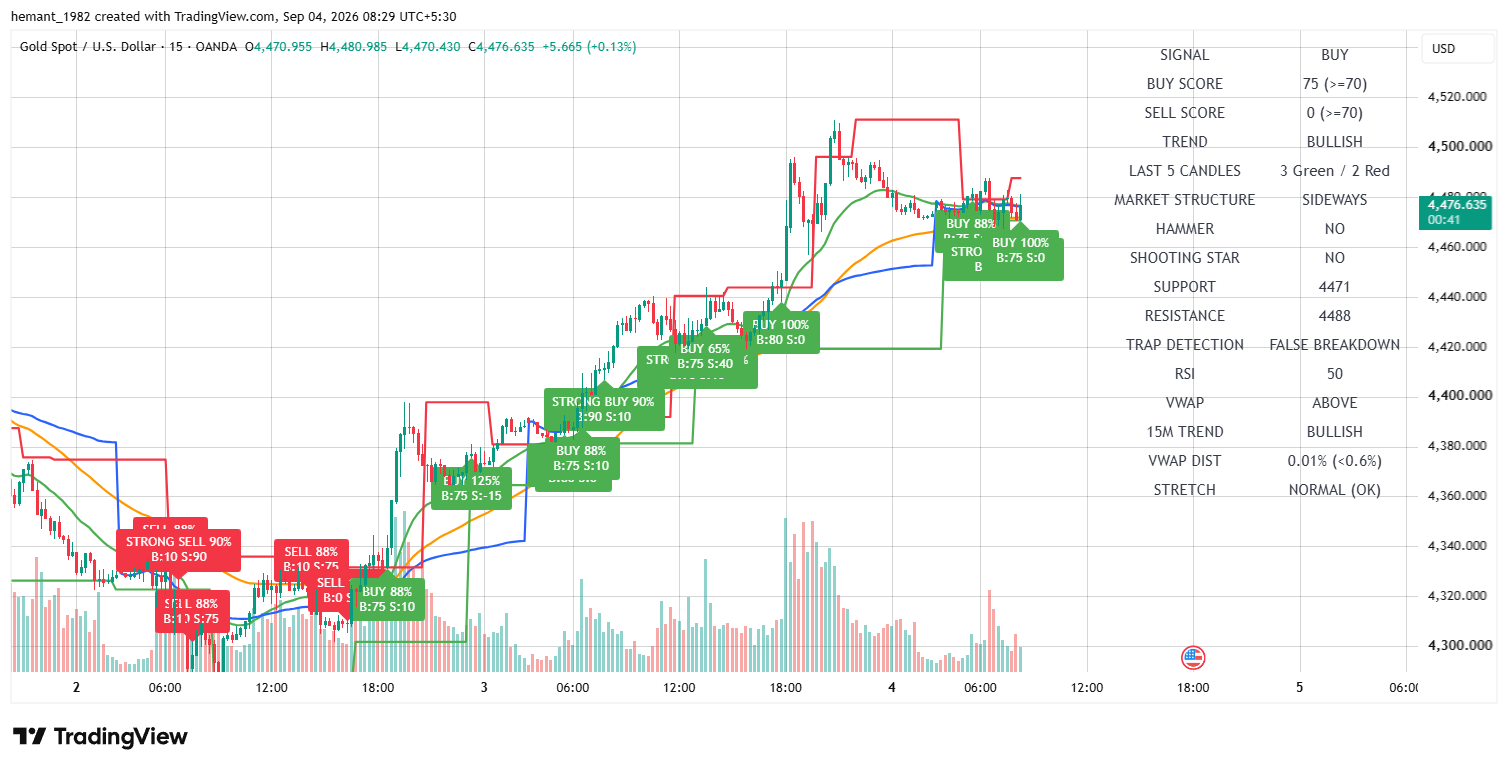
The 15M execution timeframe confirms a strong BULLISH setup accompanied by an exceptional Buy Score of 75 and a Sell Score of 0.
The RSI is perfectly balanced at 50, offering ample room for momentum expansion in either direction while reflecting current consolidation.
The immediate decision corridor is defined by support at 4,471 and resistance at 4,488. Price is oscillating directly inside this tactical range.
A clean breakout above 4,488 will signal immediate continuation toward higher objectives, whereas dips toward 4,471 present attractive risk-defined entry opportunities.
05 Key Price Levels & Market Map
| Level | Role | Technical Interpretation |
|---|---|---|
| 4,302 | 1H Support Base | Major baseline swing low providing structural multi-hour defense. |
| 4,471 | Immediate Support Pivot | Tactical 15M floor underpinning current session consolidation. |
| 4,476.35 | Current Market Price | Live trading reference evaluating immediate breakout barriers. |
| 4,488 | Immediate Resistance | Immediate overhead hurdle capping short-term impulsive advances. |
| 4,511 | 1H Overhead Resistance | Secondary target ceiling for intermediate bullish expansion. |
| 4,632 | 4H Major Resistance | Macro higher-timeframe resistance ceiling for extended targets. |
06 Scenario Analysis
07 Trader Decision Framework
08 Final Institutional Outlook
XAUUSD maintains a constructive bullish structure across tactical timeframes, trading near 4,476.35. The 15M chart displays a powerful Buy Score of 75 with zero selling pressure, while 1H and 4H indicators (RSI at 61 and 57 respectively) confirm balanced, sustainable momentum.
Market participants should focus closely on the immediate decision corridor between 4,471 and 4,488 . A breakout above resistance opens the door toward 4,511, while support defense maintains the integrity of the current recovery phase.
Disciplined execution combining strict risk controls with structured reaction entries remains essential as gold tests key intraday thresholds.
💬 XAUUSD TRADER DISCUSSIONS
Real-time execution setups & analysisPrice: $4,171.40
Bias: Short-Term Bullish (Lower TF) / Bearish (4H Macro)
Key Levels:
• Resistance: 4,146 / 4,184
• Support: 4,121 / 4,106
Quick Strategy:
Short-term momentum favors buying dips while price holds above the 4,106–4,121 support zone, targeting a push toward 4,184. Watch out for overextended RSI.
Full report: https://forexdevice.com/xauusd-technical-analysis-09-october-2026/
Hello community! Here is the latest breakdown for XAU/USD based on current 15M market structure and momentum indicators.
Market Overview:
• Current Price: 4,124.03
• Trend: Bullish / Sideways Consolidation
• RSI: 51 (Neutral)
• VWAP: Above
Actionable Trade Setups:
Setup 1: Bullish Bounce (Long)
• Entry Zone: 4,118.00 - 4,122.00 (On minor dip to support)
• Stop Loss (SL): 4,108.00
• Take Profit (TP1): 4,133.00
• Take Profit (TP2): 4,145.00
Setup 2: Bearish Breakdown (Short)
• Entry Zone: Bearish close below 4,110.00
• Stop Loss (SL): 4,118.00
• Take Profit (TP): 4,098.00 - 4,100.00
Community Discussion: Are you playing the range breakout or waiting for a deeper pullback to support? Drop your thoughts below!