FOREXDEVICE โ€ข DAILY MARKET RESEARCH
Analysis Last Updated: 05 September 2026 at 06:35 UTC

XAUUSD Technical Analysis & Structural Outlook
Daily Market Report โ€” 05 September 2026
Multi-Timeframe Confluence โ€ข 4H / 1H / 15M
XAUUSD
4,429.83
4H Bias
BEARISH
1H Bias
BULLISH
15M
BEARISH
4H RSI
48
Decision Zone
4,283โ€“4,511
Gold reflects mixed sentiment across horizons, consolidating near 4,429.83 under higher-timeframe bearish constraints while testing tactical boundaries.
XAUUSD is trading around 4,429.83 following corrective phases on higher timeframes alongside mixed intermediate structures. While the higher 4H timeframe maintains a bearish trend structure, the 1H timeframe holds a resilient bullish posture, though the short-term 15M view has flipped bearish. The 4H RSI rests at 48, pointing toward neutral-to-balanced momentum conditions.
On the execution front, immediate structural boundaries are anchored between 4,283 and 4,511 on the 4H frame, while immediate 15M parameters highlight support at 4,412 and resistance at 4,439. Participants should monitor these reaction zones carefully for definitive breakout or reversal triggers.
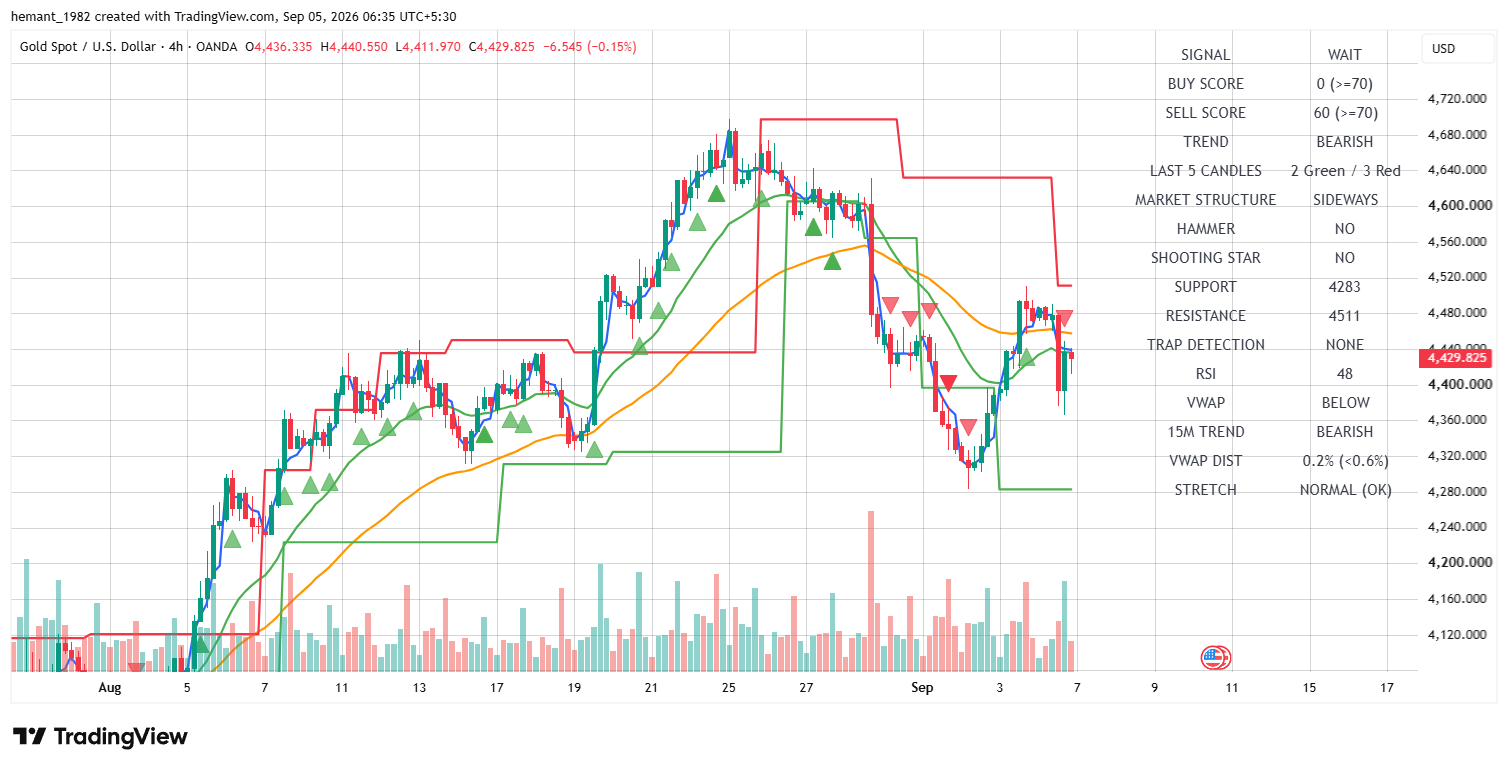
XAUUSD 4 Hour Technical Analysis โ€” 05 September 2026
XAUUSD 4H โ€” Higher-timeframe structure, trend conditions, and volatility bands
Market Structure โ€” At a Glance
Primary Trend
Bearish Pressure
4H Momentum
Sideways / Neutral
1H Structure
Bullish Baseline
15M Structure
Bearish Short-Term
Immediate Support
4,283
Immediate Resistance
4,511
Major Resistance
4,511
Preferred State
Wait / Range Bound

01 Multi-Timeframe Structural Assessment

Cross-timeframe alignment indicates ongoing tug-of-war between market participants: 15M bearish momentum โ†’ 1H bullish continuation โ†’ 4H bearish macro trend.

Price action reflects indecision as lower timeframes attempt corrective pullbacks while higher timeframes exert selling pressure from recent overhead barriers.

With the 4H RSI positioned neutrally at 48, market momentum lacks extreme overbought or oversold distortions, opening the field for localized range bound trading.

Traders should prioritize risk definition at established key price thresholds until a clear multi-timeframe breakout synchronization occurs.

02 4H Institutional View

Trend
Bearish
RSI
48
Market Structure
Sideways
VWAP
Below
Support
4,283
Resistance
4,511

The 4H timeframe outlines the macro structural picture, with XAUUSD trading near 4,429.83 under a BEARISH trend classification.

The 4H RSI reads 48, reflecting neutral momentum capacity. Sell score stands elevated at 60 while buy score registers 0.

Structural support is established near 4,283, while macro resistance ceiling is pinned at 4,511.

Sustained defense of support levels will be required to prevent deeper macro retracements.

4H Assessment
Bearish trend conditions persist with an RSI of 48 and a sell score of 60. Price remains contained between structural bounds.

03 1H Tactical Structure

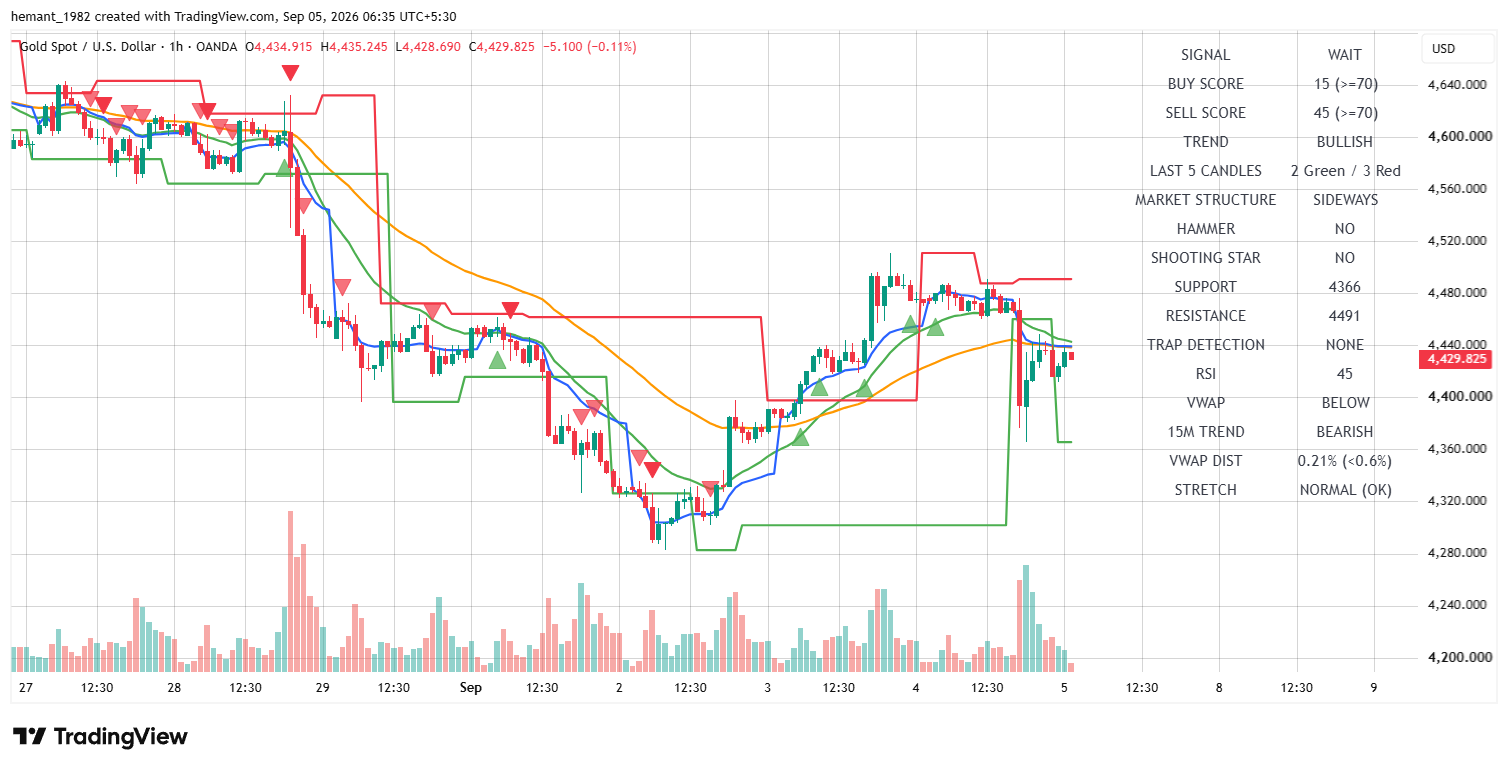
XAUUSD 1 Hour Technical Analysis โ€” 05 September 2026
XAUUSD 1H โ€” Intermediate trend progression and tactical price recovery
Trend
Bullish
RSI
45
Recent Candles
2 Green / 3 Red
VWAP
Below
Support
4,366
Resistance
4,491

The 1H chart preserves a BULLISH trend label despite short-term fluctuations, with the RSI printing at 45.

Recent candle structure displays a balanced mix (2 Green / 3 Red), highlighting steady consolidation near current levels.

Immediate 1H support is marked at 4,366, while tactical overhead resistance stands near 4,491.

Holding above intermediate support levels preserves the integrity of the 1H bullish channel.

1H Assessment
Bullish intermediate trend structure intact with RSI at 45. Price action consolidates above key support baselines.

04 15M Execution View

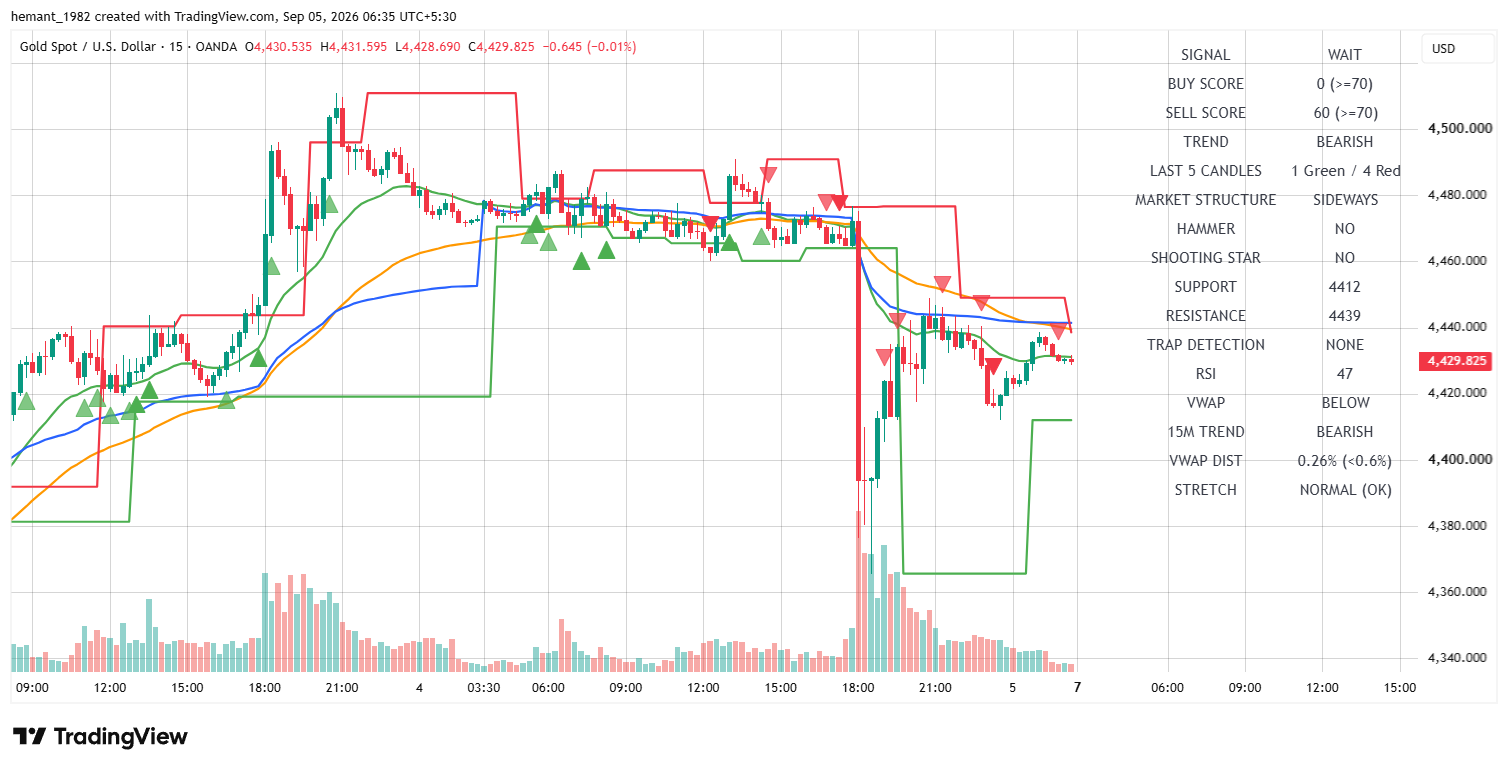
XAUUSD 15 Minute Technical Analysis โ€” 05 September 2026
XAUUSD 15M โ€” Short-term execution triggers, buy scores, and decision zones
Trend
Bearish
RSI
47
Buy Score
0
Sell Score
60
Support
4,412
Resistance
4,439

The 15M execution timeframe registers a BEARISH trend condition with a Sell Score of 60 and a Buy Score of 0.

The RSI rests at 47, providing room for short-term directional movement.

The immediate tactical corridor is bounded by support at 4,412 and resistance at 4,439. Price trades right inside this tight band at 4,429.83.

A breakout above 4,439 is required to shift short-term momentum upward, whereas a breakdown below 4,412 risks retesting deeper floors.

15M Assessment
Short-term bearish bias with a Sell Score of 60. Watch the 4,412โ€“4,439 corridor for breakout determination.

05 Key Price Levels & Market Map

LevelRoleTechnical Interpretation
4,2834H Major Support Base Macro floor establishing long-term structural defense.
4,3661H Support Level Intermediate baseline supporting the bullish tactical frame.
4,41215M Immediate Support Short-term floor underpinning current session activity.
4,429.83Current Market Price Live trading reference evaluating immediate session barriers.
4,43915M Immediate Resistance Immediate overhead hurdle capping short-term recovery attempts.
4,5114H Major Resistance Macro higher-timeframe resistance ceiling for bullish reversal.

06 Scenario Analysis

Bullish Recovery
Buyers push price cleanly above the 4,439 immediate resistance barrier. Sustained acceptance opens the path toward intermediate targets and test of the 4,491 / 4,511 macro resistance zones.
Bearish Extension
Failure to overcome overhead resistance triggers selling pressure, resulting in a test of the 4,412 support floor. A breach of 4,412 exposes deeper 1H support levels toward 4,366.
Consolidation Range
Price continues to range-trade tightly between 4,412 and 4,439 as market participants await fresh volatility triggers. Patience is recommended until directional breakout confirmation occurs.

07 Trader Decision Framework

Current Bias
Neutral to cautious short-term bearish. Mixed timeframes require disciplined risk management.
Immediate Zone
4,412โ€“4,439 acts as the primary execution corridor for intraday traders.
Bullish Trigger
Decisive 15M candle close above 4,439 with expanding volume targeting 4,491.
Bearish Trigger
Clean breakdown below 4,412 support, exposing 4,366 structural floor.
Risk Condition
Balanced momentum indicators (RSI 45โ€“48) offer clean risk-to-reward boundaries.
Preferred Approach
Trade range boundaries or wait for breakout confirmation. Utilize precise stop placements outside the 4,412โ€“4,439 decision limits.

08 Final Institutional Outlook

XAUUSD exhibits a mixed structural posture across timeframes, trading near 4,429.83. While the 4H timeframe maintains a bearish trend with an RSI of 48 and a sell score of 60, the 1H timeframe preserves a bullish baseline (RSI 45) and the 15M short-term setup navigates immediate support floors.

Market participants should monitor the immediate tactical corridor between 4,412 and 4,439 . A breakout above resistance will signal short-term bullish recovery, whereas a breakdown below support extends corrective pressure toward deeper baselines.

Strict adherence to risk controls and reaction-based setups remains paramount during current market consolidation.

Bottom Line
Primary bias: Neutral / Range Bound. Monitor the 4,412โ€“4,439 decision band for breakout continuation signals or range reversals.
Risk Disclosure: This analysis is provided for educational and informational purposes only. It represents a technical interpretation of the charts shown at the time of publication and should not be considered investment advice, a guarantee of future price movement, or a recommendation to buy or sell any financial instrument. Trading leveraged instruments such as gold and CFDs involves substantial risk. Always apply appropriate position sizing and independent risk management.

๐Ÿ’ฌ XAUUSD TRADER DISCUSSIONS

Real-time execution setups & analysis
โš ๏ธ You must log in to post here...
Per page:
๐Ÿ‡บ๐Ÿ‡ธ Sam
2026-10-10 02:33:06
Saturday Confessions: What does your trading brain do when XAUUSD is frozen? 📊☕ ================================================================== Hey Knowledge Pulse Community! Happy Saturday! As we all know, itโ€™s the weekend, the charts are frozen, and XAUUSD is securely locked at Fridayโ€™s close. In theory, this is the time weโ€™re supposed to step away, relax, and pretend we have normal non-financial hobbies. In reality? If youโ€™re anything like me, your thumb has probably opened TradingView or MetaTrader at least 5 times today just out of pure muscle memory. 😅 I just published a fun article on the main site diving into the "5 Stages of Weekend Chart Withdrawal" and how traders transition from phantom tick syndrome to weekend strategy planning: 👉 Read the full article here: https://theknowledgepulse.com/weekend-traders-life-market-closed/ -------------------------------------------------------------------------------- 🔥 QUICK COMMUNITY POLL: What is your typical weekend trading habit? [ ] Option A: Total Disconnect โ€” I close all trading apps until Sunday night. [ ] Option B: The Analyst โ€” I spend hours drawing high-timeframe zones & backtesting. [ ] Option C: Crypto Relapse โ€” I stare at BTC/ETH charts just to see something move. [ ] Option D: The Phantom Tap โ€” I constantly refresh closed charts out of habit. -------------------------------------------------------------------------------- 💬 DISCUSSION STARTERS: 1. Whatโ€™s the most "trader brain" thing youโ€™ve caught yourself doing in real life over a weekend? (e.g., converting coffee prices into pip values or mapping traffic jams as consolidation zones?) 2. Do you carry open XAUUSD positions into the weekend, or do you always close out on Friday to avoid opening gap risk? Drop your vote and letโ€™s hear your weekend thoughts below! 👇
1 0
๐Ÿ‡บ๐Ÿ‡ธ Sam
2026-10-09 12:32:49
================================================== 📌 XAUUSD TRADER'S CHEAT SHEET: A Guide to Consistency ================================================== Fellow Traders, Gold moves fast, respects no one, and rewards discipline. If you want to survive and thrive on XAUUSD, here is your core framework to keep on your desk. 📈✨ -------------------------------------------------- 1. THE GOLDEN RULES OF RISK MANAGEMENT -------------------------------------------------- โ€ข Max Risk per Trade: 1% to 2% max (no exceptions). โ€ข Spread Awareness: Always factor in London/NY session spreads. โ€ข Stop Loss: Never trade Gold without one. Period. 🛑 -------------------------------------------------- 2. MASTERING THE SESSIONS -------------------------------------------------- โ€ข London Open (08:00 UTC): Initial liquidity sweeps. Watch for fakeouts. โ€ข New York Open (13:30 UTC): Where the massive trends or reversals happen. โ€ข Avoid: Low liquidity hours during Asian session consolidation unless scalping tight ranges. 🕒 -------------------------------------------------- 3. PSYCHOLOGY CHECKLIST -------------------------------------------------- โ€ข Revenge Trading: Closed a loss? Walk away for 30 minutes. Gold will still be here. โ€ข FOMO: Chasing a runaway green candle is a quick way to donate margin. 🧘‍♂️ โ€ข Journaling: Log every setupโ€”mistakes are just tuition fees. -------------------------------------------------- Drop your thoughts below. What is your go-to timeframe for trading XAUUSD? Let's discuss! 👇🔥 ==================================================
1 0
๐Ÿ‡บ๐Ÿ‡ธ Sam
2026-10-09 10:44:19
🚀ย GoldPulse Pro Engine in Action: XAUUSD M15 Live Setup & Performance Breakdown! Hey Traders, If you have been tracking gold volatility lately, you know how crucial it is to catch clean momentum shifts without getting chopped up by sudden fakeouts. Check out our latest snapshot running the GoldPulse Pro Engine on the XAUUSD M15 timeframe (IC Markets MT4). The system has been actively managing breakout zones and locking in gains with its built-in trailing engine. Quick Strategy Specs: Asset: XAUUSD Timeframe: M15 Engine Status: Active Demo / Backtest Setup Risk & Trailing Management: Dynamic Lot Sizing (0.41 - 0.95), 350-pip Stop Loss Protection, and a responsive Trailing Engine activated at 100 pips to lock in profits securely. Clean execution and solid risk parameters are everything when trading precious metals. Want to check out the live charts, deeper technical analysis, and grab the full breakdown? Visit our trading desk here:ย  https://forexdevice.com/xauusd-pro-trading-desk/ย  Letโ€™s discuss belowโ€”how are you currently trading XAUUSD this week? Drop your thoughts or questions in the comments!
1 0
๐Ÿ‡บ๐Ÿ‡ธ Sam
2026-10-09 01:53:21
XAUUSD Technical Outlook โ€” October 9, 2026

Price: $4,171.40
Bias: Short-Term Bullish (Lower TF) / Bearish (4H Macro)

Key Levels:
โ€ข Resistance: 4,146 / 4,184
โ€ข Support: 4,121 / 4,106

Quick Strategy:
Short-term momentum favors buying dips while price holds above the 4,106โ€“4,121 support zone, targeting a push toward 4,184. Watch out for overextended RSI.

Full report: https://forexdevice.com/xauusd-technical-analysis-09-october-2026/
1 0
๐Ÿ‡บ๐Ÿ‡ธ Sam
2026-10-08 13:12:02
XAU/USD (Gold) 15-Minute Technical Analysis & Trade Setup

Hello community! Here is the latest breakdown for XAU/USD based on current 15M market structure and momentum indicators. 

Market Overview:
โ€ข Current Price: 4,124.03
โ€ข Trend: Bullish / Sideways Consolidation
โ€ข RSI: 51 (Neutral)
โ€ข VWAP: Above

Actionable Trade Setups:

Setup 1: Bullish Bounce (Long)
โ€ข Entry Zone: 4,118.00 - 4,122.00 (On minor dip to support)
โ€ข Stop Loss (SL): 4,108.00
โ€ข Take Profit (TP1): 4,133.00
โ€ข Take Profit (TP2): 4,145.00

Setup 2: Bearish Breakdown (Short)
โ€ข Entry Zone: Bearish close below 4,110.00
โ€ข Stop Loss (SL): 4,118.00
โ€ข Take Profit (TP): 4,098.00 - 4,100.00

Community Discussion: Are you playing the range breakout or waiting for a deeper pullback to support? Drop your thoughts below!
1 0
๐Ÿ‡ฟ๐Ÿ‡ฆ Tshegofatso
2026-10-08 06:16:50
Since my view on gold high timeframe is bearish,the market sweeped 4140 is the continuation to the upside to grab all the left liquidity to fuel gold to drop even further?
2 0
โ†ณ ๐Ÿ‡บ๐Ÿ‡ธ Sam
2026-10-08 06:22:26
Spot on! I totally agree with your higher timeframe bearish view. That push and sweep near 4,140 looks like a classic liquidity grabโ€”taking out resting stops to fuel the next leg down. Right now, with gold pulling back down around 4,118, it's all about watching that immediate support. If sellers keep the pressure on and break this floor, we're likely heading lower.
1 0
โ†ณ ๐Ÿ‡ฟ๐Ÿ‡ฆ Tshegofatso
2026-10-08 07:01:24
If price break below 4,118 we looking for sells?
0 0
โ†ณ ๐Ÿ‡บ๐Ÿ‡ธ Sam
2026-10-08 07:17:05
Exactly! If it breaks and holds below that 4,118โ€“4,120 floor, that's the green light for short setups. Just waiting for a clean confirmation candle close underneath so we don't get faked out by a minor wick. Let's see how it plays out!
1 0
๐Ÿ‡บ๐Ÿ‡ธ Sam
2026-10-08 02:28:34
XAUUSD TECHNICAL MARKET REPORT

ASSET: Gold Spot (XAUUSD)
CURRENT TRADING LEVEL: Approx 4,110 - 4,133 USD
OVERALL BIAS: Bearish Trend Continuation and Support Testing

MACRO STRUCTURE AND TECHNICAL OVERVIEW
Gold is facing renewed downside pressure and testing multi-week lows as markets react to a stronger US dollar and broader safe-haven shifts. Price action remains capped below key overhead resistance zones, keeping sellers in control of the near-term structure.

KEY INTRADAY LEVELS TO WATCH
Macro Resistance Ceiling: 4,170 - 4,199 USD
Tactical Overhead Hurdle: 4,145 - 4,152 USD
Immediate Support Floor: 4,104 - 4,118 USD
Major Downside Target Zone: 4,000 - 4,020 USD

TIMEFRAME BREAKDOWN

Higher Timeframe Structure: Daily and 4H charts maintain a bearish bias following the rejection from upper channels, with consistent lower highs and lows pointing to persistent downward traction.

Intermediate View: Price continues to trade under pressure below key moving averages and volume-weighted averages, confirming steady seller dominance.

Short-Term Execution: Intraday charts show attempts to stabilize near local support floors, though negative money flow indicates that selling pressure remains active on minor relief rallies.

TRADING SCENARIOS

Bearish Continuation Strategy: Look for short entries on minor intraday pullbacks or failed tests of resistance as long as price stays below the 4,145 - 4,152 tactical hurdle, targeting a deeper test toward the 4,104 floor and potentially the 4,000 psychological zone on a breakdown.

Bullish Reversal Trigger: Watch for a high-volume recovery and sustained close above the 4,170 - 4,199 resistance zone to neutralize the current downward momentum and signal a genuine relief bounce.
2 0
๐Ÿ‡บ๐Ÿ‡ธ Sam
2026-10-07 05:31:50
============================================================
OFFICIAL RELEASE: GoldPulse PRO v1.03 (MT4 & MT5)
============================================================

We have officially released Version 1.03 of GoldPulse PRO across 
both MetaTrader 4 and MetaTrader 5 terminals (`ForexDevice_GoldPulse_PRO_MT4/MT5_1.03`). 

This major update introduces institutional-grade optimizations 
engineered specifically for XAUUSD breakout mechanics.

------------------------------------------------------------
WHAT'S NEW IN VERSION 1.03:
------------------------------------------------------------
โ€ข Tighter Breakout Range: 90.0 โ€“ 350.0 pips (Optimized for faster 
  responsiveness to rapid gold momentum shifts).
โ€ข EMA 50 Trend Protection Filter: Dynamically reduces counter-trend 
  exposure by 30% to prevent fighting major market direction.
โ€ข Max Spread Safety Lock: Automatically halts grid deployments 
  during volatile news windows (40.0 pips threshold).
โ€ข Optimized Take Profit & Grid: 1600.0 pip TP targets and 20-minute 
  grid frequency for quicker cycle turns.
โ€ข Auto-Purge Memory Management: Automatically clears old visual 
  chart objects older than 2 days to keep MetaTrader terminals 
  running lightning fast.

------------------------------------------------------------
HOW TO UPDATE:
------------------------------------------------------------
1. Download the updated files (`.ex4` for MT4 / `.ex5` for MT5).
2. Replace your existing files in the MQL Experts folder.
3. Your current live license keys carry over seamlessly with zero 
   reconfiguration needed.

Full release notes and downloads:
https://forexdevice.com/eas/xauusd/goldpulse-pro-version-1-03-release-mt4-mt5/

#XAUUSD #GoldTrading #MT4 #MT5 #ForexDevice #AlgorithmicTrading
============================================================
1 0
๐Ÿ‡บ๐Ÿ‡ธ Sam
2026-10-07 02:08:00
XAUUSD Market Report | Oct 7, 2026

Gold trades near 4,149.01 under active short-term bearish pressure.

Biases: 4H Bearish | 1H Wait | 15M Bearish (Sell Score: 70)
Key Levels: Support: 4,104 / 4,144 | Resistance: 4,170 / 4,226
Outlook: Short-term momentum favors tactical downside testing below the 4,170 resistance ceiling.

[Read Full Report]  https://forexdevice.com/xauusd-technical-analysis-market-report-07-october-2026/

#XAUUSD #GoldTrading
2 0
๐Ÿ‡บ๐Ÿ‡ธ Sam
2026-10-06 01:38:33

==================================================
FOREXDEVICE โ€” XAUUSD FORUM MARKET UPDATE
Date: October 6, 2026
==================================================


CURRENT MARKET SNAPSHOT:
* Live Price: 4,136.20
* Overall Bias: BEARISH (4H / 1H / 15M synchronized)
* 4H Momentum & RSI: Bearish trend, RSI 44 (Sell Score: 70 vs 10)
* 1H Trend: Bearish continuation, RSI 45 (1 Green / 4 Red candles)
* 15M Execution View: Bearish, RSI 45 (Sell Score: 100 max)


KEY PRICE LEVELS & ZONES:
* 4,123 โ€” 1H Support Level
* 4,133 โ€” 15M Immediate Support Floor
* 4,139 โ€” 4H Macro Support Base
* 4,145 โ€” 15M Immediate Resistance / Ceiling
* 4,170 โ€” 1H Intermediate Resistance
* 4,228 โ€” 4H Macro Resistance Ceiling


TRADER DECISION FRAMEWORK & STRATEGY:
* Strategy: Look for short setups on tactical bounces or ride downward momentum with trailing stops.
* Risk Control: Maintain strict stop-loss placements above the 4,145 resistance hurdle.
* Target / Focus: Monitor immediate support tests at 4,133 โ€“ 4,139 as sellers target lower floors.


Read the full institutional breakdown and charts here:
https://forexdevice.com/xauusd-technical-analysis-october-6-2026/
==================================================
2 0
...