XAUUSD Technical Analysis & Structural Outlook
01 Multi-Timeframe Structural Assessment
The interaction across timeframes points to an aggressive momentum shift: 15M bullish impulse → 1H transitional recovery → 4H structural balance.
Traders should note that lower-timeframe strength has accelerated rapidly, carving out higher highs and breaking past former supply clusters. This indicates that buyers have seized short-term tactical control.
While higher timeframes like the 1H still register baseline structural tags, the sharp influx of green candles and a healthy 4H RSI of 51 demonstrate that the market has neutralized previous oversold pressure, opening the path for continuation.
The optimal framework involves utilizing minor intraday pullbacks toward immediate support zones as structural entry points, rather than chasing extended green expansion candles blindly.
02 4H Institutional View
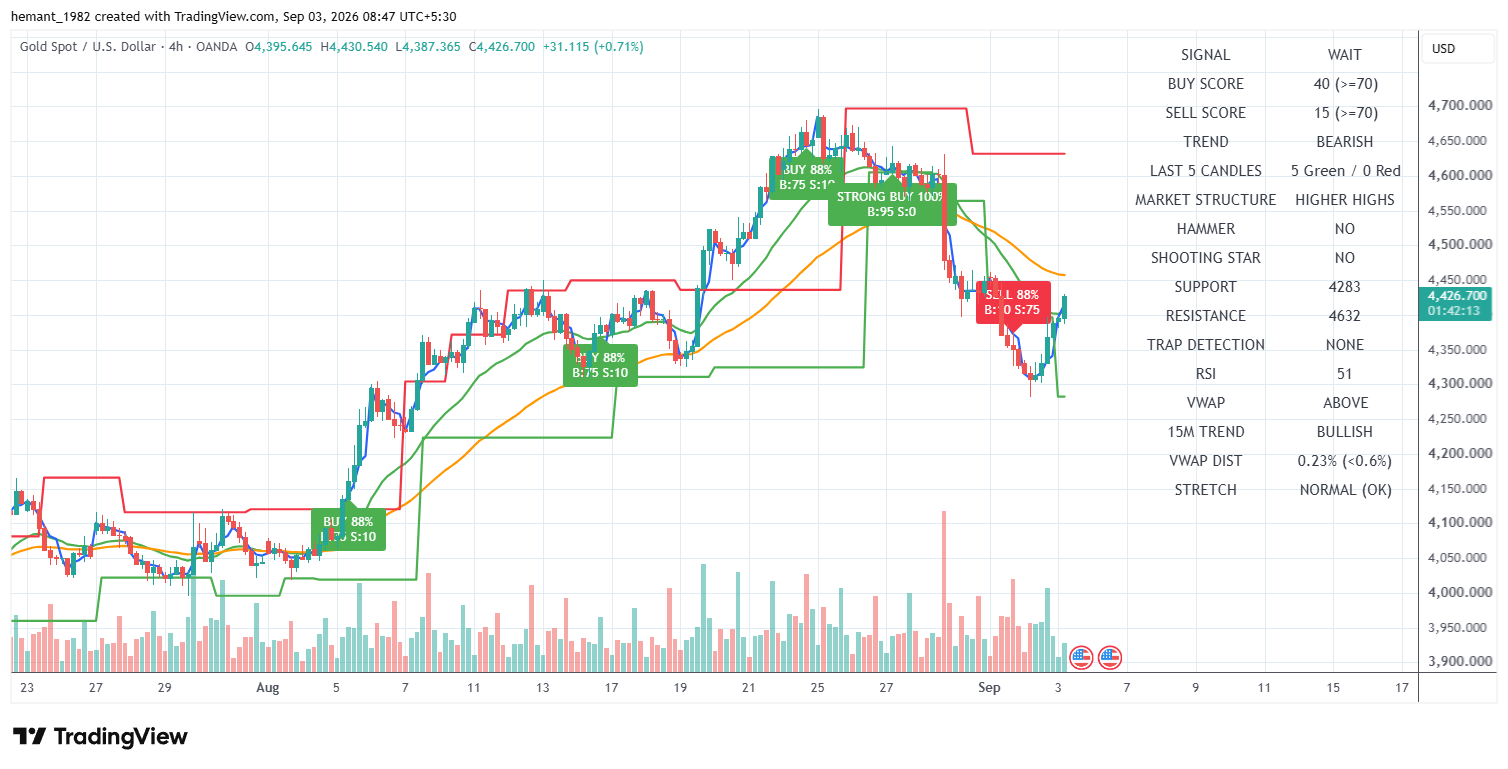
The 4H chart captures the broader market context, with price expanding aggressively upward to trade near 4,426.
The 4H RSI has normalized to 51, reflecting a complete reset of momentum following earlier extremes. This balanced reading gives the current leg up structural sustainability.
Key support is pegged around 4,283, while major overhead resistance is situated near 4,632. The swift bounce from lower boundaries confirms strong institutional defense of deeper value zones.
As price continues to print constructive candles, the macro framework shifts from defensive consolidation to active structural re-accumulation.
03 1H Tactical Structure
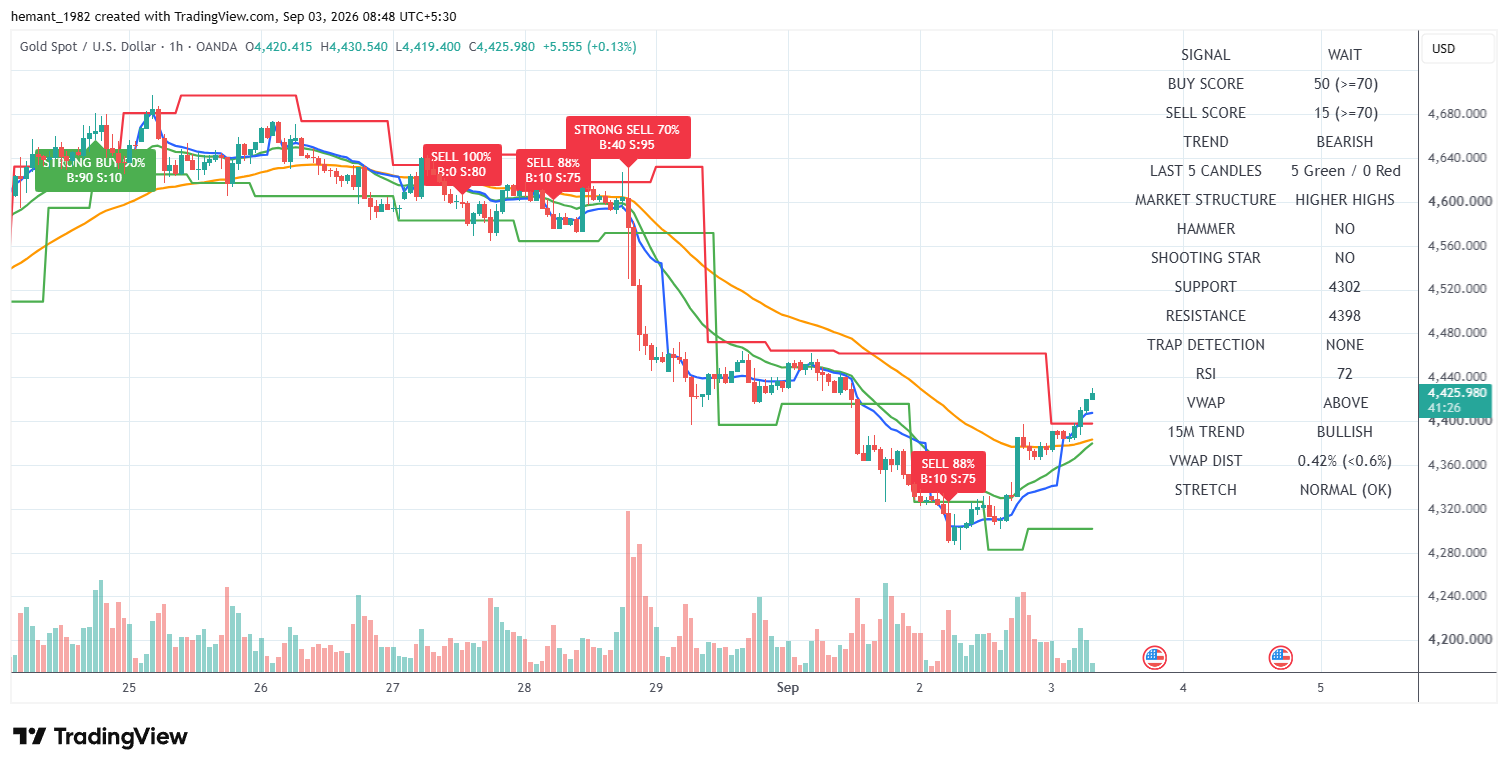
The 1H chart demonstrates heavy buying velocity, highlighted by an unbroken sequence of 5 consecutive green candles driving price toward 4,425.
RSI has climbed to 72, entering short-term overbought territory. This reflects strong impulsive momentum driven by active market participation rather than a slow drift.
Immediate support is identified at 4,302, with near resistance positioned at 4,398, which price has successfully challenged and penetrated.
While overbought RSI conditions can sometimes precede shallow consolidation, the sheer intensity of the green candle sequence points to persistent buyer demand on any minor dip.
04 15M Execution View
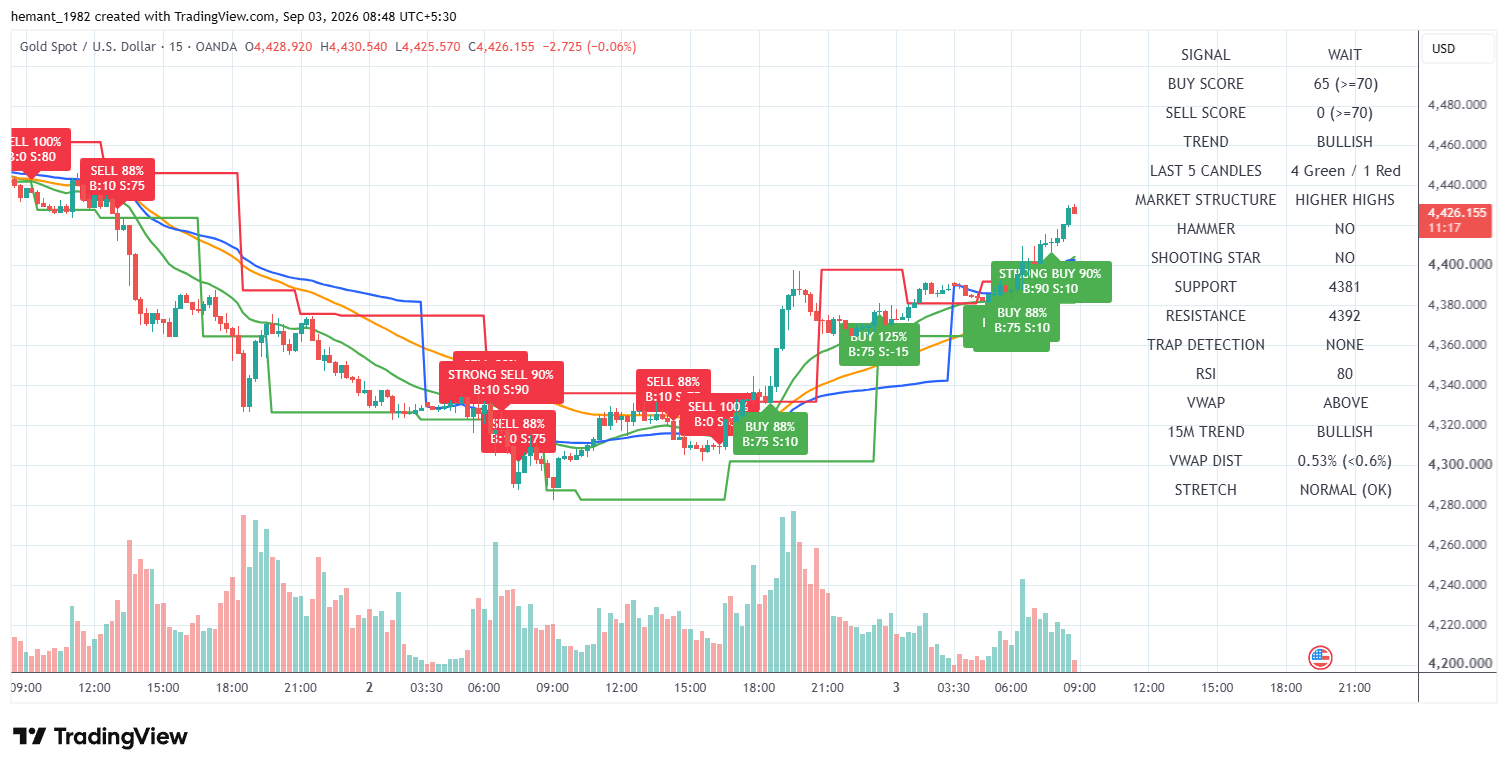
The 15M execution timeframe confirms an active BULLISH market structure, characterized by higher highs and high-conviction buy tags.
RSI stands firm at 80, accompanied by a robust Buy Score of 65 and a Sell Score of 0. This stark metric divergence shows a complete absence of selling interest in the current impulse leg.
The immediate decision zone is defined by support at 4,381 and resistance at 4,392. Price has vaulted past these markers, turning former resistance into a supportive foundation.
Traders should monitor whether minor retracements find bids near the breakout corridor, as continuation patterns remain favored under these high-score conditions.
05 Key Price Levels & Market Map
| Level | Role | Technical Interpretation |
|---|---|---|
| 4,302 | 1H Support Base | Primary swing low foundation established during the prior base building phase. |
| 4,381 | 15M Support Pivot | Immediate tactical support floor underpinning the current impulsive advance. |
| 4,392 | Near Resistance / Pivot | Breakout threshold converted into an active support retest zone. |
| 4,426 | Current Market Price | Live trading reference exhibiting strong short-term upward momentum. |
| 4,462 | Intermediate Target | Next major structural overhead liquidity and extension objective. |
| 4,632 | 4H Major Resistance | Macro higher-timeframe resistance ceiling for long-term targets. |
06 Scenario Analysis
07 Trader Decision Framework
08 Final Institutional Outlook
XAUUSD has staged a vigorous bullish expansion driven by strong buying pressure across intraday charts. The 15M trend is firmly bullish with a Buy Score of 65 and zero sell pressure, while the 4H RSI reset to 51 provides a clean structural foundation for sustainable momentum.
Although short-term indicators are elevated due to consecutive green expansion candles, the market structure favors buyers as long as critical support floors remain defended.
For active participants, 4,381–4,392 remains the essential operational pivot zone. Holding above this band keeps the door open for an extension toward intermediate resistance at 4,462, whereas failure would trigger a healthy consolidation phase toward deeper support.
The most disciplined strategy is to look for controlled pullbacks into support rather than chasing extremes, maintaining rigorous risk management in line with dynamic market volatility.
💬 XAUUSD TRADER DISCUSSIONS
Real-time execution setups & analysisPrice: $4,171.40
Bias: Short-Term Bullish (Lower TF) / Bearish (4H Macro)
Key Levels:
• Resistance: 4,146 / 4,184
• Support: 4,121 / 4,106
Quick Strategy:
Short-term momentum favors buying dips while price holds above the 4,106–4,121 support zone, targeting a push toward 4,184. Watch out for overextended RSI.
Full report: https://forexdevice.com/xauusd-technical-analysis-09-october-2026/
Hello community! Here is the latest breakdown for XAU/USD based on current 15M market structure and momentum indicators.
Market Overview:
• Current Price: 4,124.03
• Trend: Bullish / Sideways Consolidation
• RSI: 51 (Neutral)
• VWAP: Above
Actionable Trade Setups:
Setup 1: Bullish Bounce (Long)
• Entry Zone: 4,118.00 - 4,122.00 (On minor dip to support)
• Stop Loss (SL): 4,108.00
• Take Profit (TP1): 4,133.00
• Take Profit (TP2): 4,145.00
Setup 2: Bearish Breakdown (Short)
• Entry Zone: Bearish close below 4,110.00
• Stop Loss (SL): 4,118.00
• Take Profit (TP): 4,098.00 - 4,100.00
Community Discussion: Are you playing the range breakout or waiting for a deeper pullback to support? Drop your thoughts below!