FOREXDEVICE โ€ข DAILY MARKET RESEARCH
Analysis Last Updated: 02 September 2026 at 08:30 UTC

XAUUSD Technical Analysis & Structural Outlook
Daily Market Report โ€” 02 September 2026
Multi-Timeframe Confluence โ€ข 4H / 1H / 15M
XAUUSD
4,326.07
4H Bias
BEARISH
1H Bias
BEARISH
15M
RECOVERY
4H RSI
26
Decision Zone
4,326โ€“4,336
Higher-timeframe structure remains bearish, while the lower timeframe is attempting a tactical recovery from the 4,300 area.
XAUUSD is trading around 4,326 after a pronounced decline. The 4H and 1H structures remain under bearish control, with price below key trend references and VWAP remaining above price. The 4H RSI at 26 signals significant downside momentum and an oversold condition, increasing the probability of short-term stabilization but not, by itself, confirming a trend reversal.
On the 15M chart, price has stabilized around the 4,300โ€“4,310 region and RSI has recovered toward 58. This creates a short-term recovery attempt inside a broader bearish structure. The immediate decision area is 4,326โ€“4,336. A sustained reclaim of this area would improve the recovery setup, while rejection followed by renewed selling pressure would favor continuation of the prevailing bearish structure.
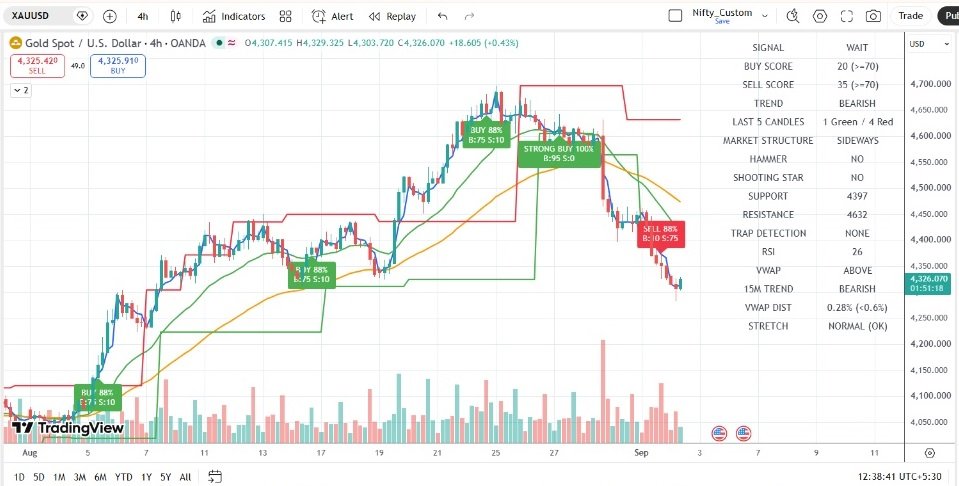
XAUUSD 4 Hour Technical Analysis โ€” 02 September 2026
XAUUSD 4H โ€” Higher-timeframe structure, momentum and major trend condition
Market Structure โ€” At a Glance
Primary Trend
Bearish
4H Momentum
Weak / Oversold
1H Structure
Bearish
15M Structure
Recovery Attempt
15M Support
4,283
Near Resistance
4,336
Major Resistance
4,462 / 4,632
Preferred State
Wait for Confirmation

01 Multi-Timeframe Structural Assessment

The three timeframes establish a clear hierarchy: 4H bearish control โ†’ 1H bearish continuation โ†’ 15M recovery attempt.

This distinction is important for traders. The 15M improvement should not automatically be interpreted as a reversal of the broader trend. Instead, it currently represents a lower-timeframe counter-move that needs to overcome nearby resistance before it can materially alter the higher-timeframe structure.

The strongest directional evidence currently comes from the higher timeframes. Both the 4H and 1H charts remain bearish, while VWAP remains above price. This keeps the broader directional risk tilted to the downside.

At the same time, the deeply depressed 4H RSI and improving 15M momentum warn against chasing fresh shorts after an extended decline. The better framework is to wait for either a confirmed recovery or renewed downside confirmation.

02 4H Institutional View

Trend
Bearish
RSI
26
VWAP
Above Price
Structure
Sideways
Support
4,397
Resistance
4,632

The 4H chart remains the dominant structural reference. Price has experienced a substantial decline from the upper 4,600s and is now trading around 4,326.

The trend panel continues to classify the broader condition as BEARISH. The most important momentum observation is the RSI reading near 26. This confirms that downside momentum has become significantly extended.

However, an oversold RSI should not be treated as an automatic buy signal. In a strong bearish phase, RSI can remain depressed while price continues lower. The current RSI should therefore be interpreted as evidence of stretched downside momentum rather than proof of a completed reversal.

The displayed 4H support reference is approximately 4,397, while resistance is identified around 4,632. With price currently below that support reference, the higher-timeframe structure remains vulnerable.

4H Assessment
Bearish structure remains dominant. The deeply oversold RSI increases the probability of stabilization or a corrective rebound, but does not independently establish a trend reversal.

03 1H Tactical Structure

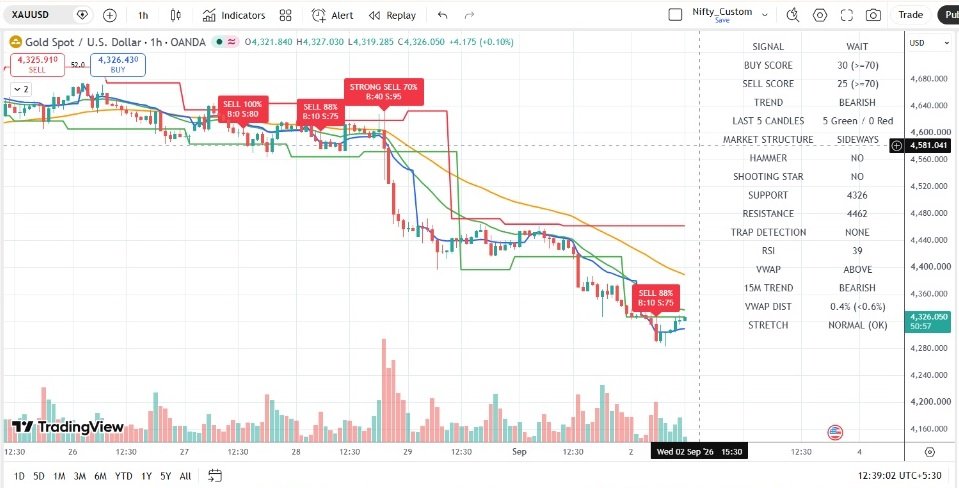
XAUUSD 1 Hour Technical Analysis โ€” 02 September 2026
XAUUSD 1H โ€” Intermediate bearish structure and developing stabilization
Trend
Bearish
RSI
39
Recent Candles
5 Green
VWAP
Above Price
Support
4,326
Resistance
4,462

The 1H chart provides the clearest view of the intermediate trend. Price has undergone a sharp breakdown followed by stabilization around the 4,300โ€“4,330 region.

The trend classification remains BEARISH, while VWAP remains above price. This combination indicates that the recent bounce has not yet displaced the broader intraday supply structure.

RSI has recovered toward 39, suggesting that downside momentum is less extreme than on the 4H timeframe. This is consistent with the recent stabilization and explains why the lower timeframe is beginning to display recovery characteristics.

The immediate structural reference is approximately 4,326. A recovery above the immediate zone would bring the larger resistance around 4,462 into focus.

Importantly, the 1H chart has not yet produced enough evidence to classify the broader decline as reversed. Until price begins reclaiming meaningful resistance, the recovery should be treated as a counter-trend move within the larger bearish structure.

1H Assessment
The 1H structure remains bearish, but the sharp decline has entered a stabilization phase. Recent green candles indicate short-term demand, while the broader trend remains below key resistance.

04 15M Execution View

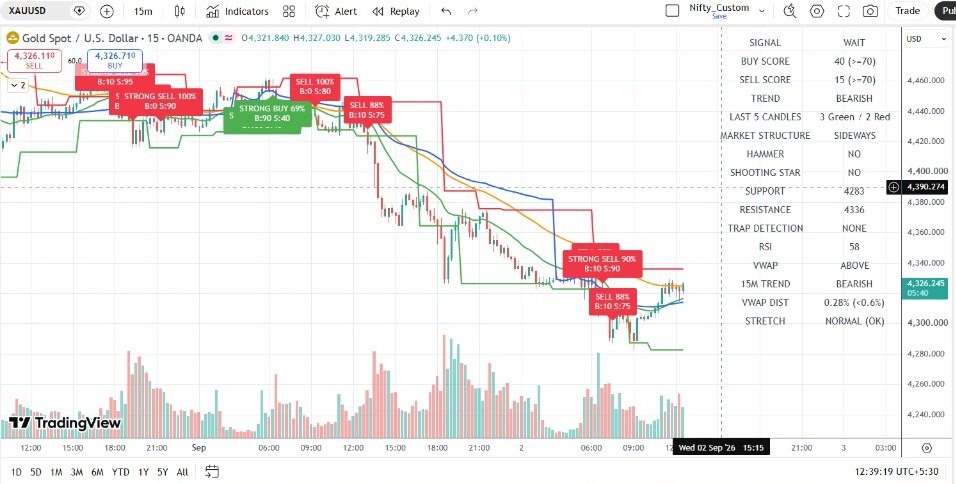
XAUUSD 15 Minute Technical Analysis โ€” 02 September 2026
XAUUSD 15M โ€” Short-term recovery attempt and immediate decision zone
Trend
Bearish
RSI
58
Buy Score
40
Sell Score
15
Support
4,283
Resistance
4,336

The 15M chart is currently the most constructive timeframe, but it remains subordinate to the 4H and 1H bearish structure.

Price has stabilized close to 4,300 following the sharp decline. RSI has recovered to approximately 58, indicating that short-term momentum has improved substantially from the oversold condition visible on the higher timeframe.

The critical issue is that the displayed 15M trend remains BEARISH. The recovery therefore requires additional price confirmation before it can be considered a meaningful structural shift.

Immediate resistance is approximately 4,336. This is the key short-term decision level. A sustained move above this region would strengthen the recovery thesis, while rejection followed by renewed selling would favor continuation of the prevailing bearish trend.

Traders should therefore focus less on the RSI number alone and more on the interaction between price, resistance and subsequent candle structure around this decision zone.

15M Assessment
Short-term momentum has improved and the market is attempting to recover, but the recovery remains unconfirmed. The 4,326โ€“4,336 region is the immediate battleground.

05 Key Price Levels & Market Map

LevelRoleTechnical Interpretation
4,28315M Support Important downside reference if the current recovery fails.
4,326Immediate Pivot Current price area and first short-term decision reference.
4,336Near Resistance First important confirmation level for a sustained recovery.
4,3974H Reference Higher-timeframe support reference displayed on the 4H panel.
4,4621H Resistance Major intermediate resistance and potential retracement objective.
4,6324H Resistance Major higher-timeframe resistance.

06 Scenario Analysis

Bullish Recovery
A sustained reclaim of 4,336, followed by acceptance above the level rather than immediate rejection, would strengthen the short-term recovery thesis. If momentum continues to build, the larger 4,462 resistance becomes the next important structural reference.
Bearish Continuation
Failure around the 4,326โ€“4,336 zone followed by renewed selling pressure would keep the broader bearish structure intact. A breakdown beneath the recent stabilization region would shift attention toward the 4,283 support reference.
Range / No Trade
If price remains trapped between approximately 4,300 and 4,336 without directional confirmation, the market may continue producing low-quality signals. In such conditions, waiting for a confirmed structural move may provide a superior risk framework to forcing an entry.

07 Trader Decision Framework

Current Bias
Bearish on higher timeframes. The 15M chart is showing a counter-trend recovery attempt.
Immediate Zone
4,326โ€“4,336 is the primary short-term decision area.
Bullish Trigger
Sustained acceptance above 4,336 would provide stronger evidence that the 15M recovery is developing into a larger retracement.
Bearish Trigger
Rejection around the decision zone followed by renewed downside momentum would favor continuation of the established bearish trend.
Risk Condition
Do not treat the 4H RSI of 26 as a standalone buy signal. Oversold conditions can persist during strong directional trends.
Preferred Approach
Wait for confirmation. The current multi-timeframe structure does not justify blindly chasing either direction at the present location.

08 Final Institutional Outlook

XAUUSD remains in a higher-timeframe bearish structure following the recent decline. The 4H and 1H charts continue to provide the strongest directional evidence, while the 15M chart is attempting to build a short-term recovery from the 4,300 region.

The market is therefore positioned at an important transition point rather than offering a clean directional setup. The combination of a deeply oversold 4H RSI and improving 15M momentum creates room for a corrective rebound, but the broader trend remains bearish until price can reclaim meaningful resistance and demonstrate sustained acceptance above it.

For short-term traders, 4,326โ€“4,336 should remain the primary observation zone. A confirmed breakout and hold above this region would improve the recovery scenario. A rejection and renewed downside impulse would instead reinforce the dominant bearish structure.

The highest-quality approach is therefore to allow price to confirm the next structural move rather than attempting to predict it solely from the current RSI or short-term candle recovery.

Bottom Line
Primary bias: Bearish. Short-term recovery is developing, but confirmation is still required. The 4,326โ€“4,336 region is the immediate battleground.
Risk Disclosure: This analysis is provided for educational and informational purposes only. It represents a technical interpretation of the charts shown at the time of publication and should not be considered investment advice, a guarantee of future price movement, or a recommendation to buy or sell any financial instrument. Trading leveraged instruments such as gold and CFDs involves substantial risk. Always apply appropriate position sizing and independent risk management.

๐Ÿ”ฅ XAUUSD LIVE MARKET DISPATCH

Daily institutional setups & algorithmic analysis
โš ๏ธ You must log in to post here...
Per page:
Community Trading Desk
Use โšก LOGIN / REGISTER above to post your XAUUSD setup or join today's discussion!
๐Ÿ‡บ๐Ÿ‡ธ Sam
2026-10-21 02:03:37
================================================== โœฆ FOREXDEVICE FORUM DISCUSSION & MARKET UPDATE ================================================== Date & Time : 21 October 2026 | 07:13 UTC Asset : XAUUSD (Spot Gold) Current Price: $4,117.46 Market Bias : BEARISH (Synchronized Multi-TF) ================================================== 📊 THREAD OVERVIEW: Gold is showing strong, synchronized bearish alignment across all timeframes today. Sellers remain firmly in control with price holding below key intraday resistance levels. โ€ข 4H RSI Level : 40 (Sustained downside pressure) โ€ข Macro Decision Zone : $4,074 โ€“ $4,199 ================================================== 📉 MULTI-TIMEFRAME STRUCTURE: ================================================== โ€ข 4H Macro View : BEARISH (Structure defensive; Sell Score: 50 vs Buy: 20) โ€ข 1H Tactical View : BEARISH (False breakdown trap detected; RSI: 43) โ€ข 15M Execution View : BEARISH (Active short signal; Sell Score: 75 | Shooting Star) ================================================== 🔑 KEY PRICE LEVELS & CORRIDORS: ================================================== โ€ข Major Resistance : $4,199 โ€ข 1H Resistance : $4,156 โ€ข 15M Immediate Res. : $4,132 โ€ข Current Market Price : $4,117.46 โ€ข 15M Immediate Support : $4,119 โ€ข 1H Support : $4,112 โ€ข 4H Structural Target : $4,074 ================================================== ⚡ TRADE SCENARIOS & DISCUSSION FRAMEWORK: ================================================== 1️⃣ Bearish Continuation (Primary): Rejections under $4,132 push price through intraday support ($4,112โ€“$4,119) toward macro support at $4,074. 2️⃣ Relief Bounce: A sustained push back above $4,132 opens short-covering potential toward $4,156. 💬 What are your thoughts on today's Gold action? Are you looking for sell setups on pullbacks toward $4,132, or waiting for a breakdown below $4,112? 🔗 Read the Full Report & Interactive Terminal Charts: https://forexdevice.com/xauusd-technical-analysis-21-october-2026/
0 0
๐Ÿ‡บ๐Ÿ‡ธ Sam
2026-10-20 09:09:00
DATE: Tuesday, October 20, 2026 TIME: 02:34 PM IST =========================== 📊 XAU/USD (GOLD) M15 TECHNICAL MARKET ANALYSIS 📊 Gold continues its sharp downside momentum on the M15 timeframe, making a series of clear lower highs and lower lows after failing near the 4,196 resistance level. Sellers remain in full control as prices press into critical support. ---------------------------------------- 📈 KEY LEVELS TO WATCH: ---------------------------------------- โ€ข Current Price: 4,117.74 🔴 RESISTANCE ZONES: - R1: 4,127.50 - 4,139.00 (Immediate Supply) - R2: 4,150.00 - 4,173.50 (Major Resistance) 🟢 SUPPORT ZONES: - S1: 4,116.00 (Current Local Low) - S2: 4,080.00 - 4,050.00 (Key Target Zone) -------------------------------------------------- 💡 TRADING SCENARIO & OUTLOOK: -------------------------------------------------- โ€ข BEARISH CONTINUATION: A sustained break below 4,116.00 opens the door for a push lower toward the 4,080 - 4,050 zone. โ€ข BULLISH RETRACE: Any short-term pullback toward the 4,127 - 4,139 area is likely to face heavy selling pressure unless price reclaims above 4,150. ⚠️ Risk Management: Always use proper lot sizing and stop-loss orders. Past performance is not indicative of future results. -------------------------------------------------- 🚀 TAKE YOUR GOLD TRADING TO THE NEXT LEVEL! -------------------------------------------------- Automate your strategy with the GoldPulse EA and catch high-probability setups effortlessly! 👉 Get instant access & view pricing plans here: https://forexdevice.com/eas/xauusd/pricing/
0 0
๐Ÿ‡บ๐Ÿ‡ธ Sam
2026-10-20 02:27:45
🔥 XAUUSD MARKET UPDATE: Bearish Continuation on All Timeframes! (Oct 20, 2026) Gold (XAUUSD) is currently trading around $4,132.54, facing persistent downside pressure across both macro and lower timeframes. Here is the breakdown of our latest institutional technical report: 📊 Multi-Timeframe Structure * 4H Macro Bias: Bearish (RSI: 43 | Sell Score: 60 vs 20) โ€” Printing lower lows within a macro bearish channel. * 1H Tactical Bias: Bearish (RSI: 31 | Sell Score: 50 vs 45) โ€” Ongoing intermediate downside continuation. * 15M Execution Bias: Bearish (RSI: 45) โ€” Testing immediate intraday support. 🔑 Key Price Levels to Watch * Macro Support Base: $4,074 * Immediate 15M Support: $4,137 * Immediate 15M Resistance: $4,139 * 1H Support/Pivot: $4,155 * Macro Resistance Ceiling: $4,199 💡 Trader Decision Framework * Primary Bias: Moderately Bearish (Trend Continuation) * Strategy: Look for short setups off tactical rallies or ride downside momentum with strict stop-losses kept above immediate overhead resistance ($4,139 - $4,155). 🔗 Read the full detailed technical report and interactive charts here: https://forexdevice.com/xauusd-technical-analysis-20-october-2026/ *What are your thoughts on today's gold price action? Are you looking to short the rallies or waiting for a support bounce around $4,074? Let's discuss below!* 👇
1 0
๐Ÿ‡บ๐Ÿ‡ธ Sam
2026-10-19 05:11:43
📊 XAUUSD TECHNICAL ANALYSIS & STRUCTURAL OUTLOOK 📅 Date: 19 October 2026 🌐 Source: Forex Device Daily Market Research ================================================== [CURRENT MARKET STATUS] โ€ข Live Price: 4,178.295 โ€ข 4H Bias: BEARISH (Macro Filter / RSI: 56) โ€ข 1H Bias: BUY / BULLISH (Intermediate / RSI: 55) โ€ข 15M Bias: WAIT / SIDEWAYS (Execution / RSI: 55) โ€ข Decision Range: 4,074 โ€“ 4,201 -------------------------------------------------- 📌 1. MULTI-TIMEFRAME STRUCTURAL BREAKDOWN -------------------------------------------------- โ€ข 15M View: Short-term consolidation & neutral momentum. Buy Score: 60 | Sell Score: 25. โ€ข 1H View: Intermediate trend recovery confirmed. Candles reflect steady buying strength. โ€ข 4H View: Macro trend remains under a bearish filter, but neutral RSI (56) and buy score superiority (55 vs 15) indicate active consolidation near support. -------------------------------------------------- 🎯 2. KEY PRICE LEVELS & MAP -------------------------------------------------- โ€ข Major 4H Support Base: 4,074 โ€ข 1H Intermediate Support: 4,155 โ€ข 15M Immediate Support: 4,166 โ€ข Current Market Reference: 4,178.295 โ€ข 15M/1H Immediate Resistance: 4,185 / 4,199 โ€ข Major 4H Resistance Ceiling: 4,201 -------------------------------------------------- ⚡ 3. SCENARIO PLANNING -------------------------------------------------- 1. Bullish Continuation: Buyers hold above the 4,166 / 4,155 support corridor, pressing toward the 4,185 immediate hurdle and testing macro resistance at 4,201. 2. Bearish Pullback / Reversal: Overhead resistance rejection triggers profit-taking, pulling price back toward the 4,155 support floor. A clean break lower re-exposes deeper macro levels. -------------------------------------------------- 💡 4. TRADER DECISION FRAMEWORK -------------------------------------------------- โ€ข Tactical Bias: Bullish on lower timeframes; macro caution warranted near 4,201. โ€ข Actionable Zone: 4,155 โ€“ 4,185 execution corridor. โ€ข Strategy: Look for long setups on tactical pullbacks or ride momentum cleanly, keeping strict stop-loss protection below the 4,155 support base. ==================================================
1 0
๐Ÿ‡บ๐Ÿ‡ธ Sam
2026-10-17 16:09:35
🚨 The Weekend Dilemma: Who's holding a losing XAUUSD trade right now? 📉💀 Friday 4:58 PM hits. Your gold buy position is deep in the red. Do you close and take the small loss, or hold over the weekend because "Gold always bounces back at Asia open"? 🤡 If you chose to hold, congratulations! You have officially entered the emotional blender. We just published a fun, painfully relatable look at what actually goes through a trader's head during those 48 hours of pure agony and denial. 👉 Check out the 5 stages here: https://forexdevice.com/holding-losing-gold-over-weekend-stages/ How are you feeling about your positions this weekend? Drop your thoughts below! 👇
1 0
๐Ÿ‡บ๐Ÿ‡ธ Sam
2026-10-16 01:46:10
================================================== FOREXDEVICE FORUM DISCUSSION: XAUUSD ANALYSIS Date: October 16, 2026 ================================================== 🔥 XAUUSD Live Market Breakdown: Bearish Pressure & Key Levels to Watch ($4,149 Pivot) Hello Traders, Gold is currently facing significant downside momentum on the intraday and 4-hour charts, hovering around the $4,149.01 mark. Here is how the structural bias and key levels are lining up across timeframes today: Timeframe Alignments: โ€ข 4H Bias: Bearish (RSI: 47 | Heavy sell score favoring downside) โ€ข 1H Bias: Neutral / Consolidation zone โ€ข 15M Bias: Bearish (RSI: 33 indicating short-term oversold conditions) Critical Levels for Today's Session: โ€ข Macro Resistance Ceiling: $4,226.00 โ€ข Immediate Resistance Zone: $4,170.00 โ€“ $4,183.00 โ€ข Intraday Execution Corridor: $4,144.00 โ€“ $4,170.00 โ€ข Immediate Support Floor: $4,144.00 / $4,162.00 โ€ข Macro Support Base: $4,104.00 Trading Scenarios & Strategy: 1. Bearish Continuation: Look for rejections around the $4,162 โ€“ $4,170 resistance corridor or a clean breakdown below the $4,144 support floor to target a slide toward the $4,104 macro base. 2. Bullish Relief Bounce: Watch for buyer defense as the 15M RSI sits near oversold (33). A recovery back above VWAP could spark a relief rally toward $4,170.00. Read the full detailed report with live charts and indicators here: 🔗 https://forexdevice.com/xauusd-technical-analysis-16-october-2026/ What is your bias for today's session? Are you buying the dip near support or shorting the rallies? Drop your thoughts below! 👇 ==================================================
1 0
๐Ÿ‡บ๐Ÿ‡ธ Sam
2026-10-15 01:35:21
+-------------------------------------------------------------+ | XAUUSD TRADING DESK & QUICK NOTESย  | | Date: October 15, 2026ย  ย  ย  ย  ย  ย  ย  ย  ย  ย  ย  ย  ย  ย  ย  ย  ย  ย  ย | +-------------------------------------------------------------+ [ MARKET SNAPSHOT ] โ€ข Live Price : $4,148.78 โ€ข 4H Trend : Bearish (RSI: 50 | Neutral/Consolidation) โ€ข 1H Trend : Bearish (RSI: 61 | 5 Green / 0 Red Candles) โ€ข 15M Trend : Bullish (RSI: 76 | Buy Score: 80) [ KEY PRICE LEVELS ] โ€ข Macro Floor (4H Support) : $4,067 โ€ข Intermediate Support (1H) : $4,074 โ€ข Intraday Support (15M) : $4,097 โ€ข Immediate Resistance : $4,107 โ€ข Tactical Hurdle (1H) : $4,170 โ€ข Macro Resistance Ceiling (4H) : $4,201 [ TRADER GAMEPLAN & STRATEGY ] 1. SETUP: Lower timeframes show strong buying pressure (15M RSI at 76, Buy Score 80), while higher 4H structures keep a broader macro filter active. 2. EXECUTION CORRIDOR: Watch the $4,074 โ€“ $4,097 zone. Short-term momentum favors buying dips as long as this floor holds. 3. UPSIDE TARGET: Sustained momentum above current levels opens up a clear path toward the $4,201 macro resistance ceiling. 4. RISK CONTROL: Keep tight stops below the $4,074 support level. Overextended lower-timeframe RSI requires caution near macro resistance barriers. +-------------------------------------------------------------+ Full Analysis: https://forexdevice.com/xauusd-technical-analysis-october-15-2026/ +-------------------------------------------------------------+
0 0
๐Ÿ‡บ๐Ÿ‡ธ Sam
2026-10-14 01:43:45
โ•”โ•โ•โ•โ•โ•โ•โ•โ•โ•โ•โ•โ•โ•โ•โ•โ•โ•โ•โ•โ•โ•โ•โ•โ•โ•โ•โ•โ•โ•โ•โ•โ•โ•โ•โ•โ•โ•โ•โ•โ•โ•โ•โ•โ•โ•โ•โ•โ•โ•โ•โ•โ•โ•โ•โ•โ•โ•โ•โ•โ•โ•โ•โ•โ•โ•โ•— โ•‘ 🎯 TRADER'S DAILY NOTES: XAUUSDย  ย  ย  ย  ย  ย  ย  ย  ย  ย  ย  ย  ย  ย  ย  ย  ย  ย  ย  ย  ย  ย  ย  ย  ย  ย  ย  ย  ย  ย  ย  ย  ย  ย  ย  ย  ย  ย  ย  ย  ย  ย  ย  ย  ย  ย  ย  ย  ย  ย  โ•‘ โ•‘ 📅 Date: 14 October 2026 | 07:01 UTCย  ย  ย  ย  ย  ย  ย  ย  ย  ย  ย  ย  ย  ย  ย  ย  ย  ย  ย  ย  ย  ย  ย  ย  ย  ย  ย  ย  ย  ย  ย  ย  ย  ย  ย  ย  ย  ย  ย  ย  ย  ย  ย  ย  ย  ย  ย  ย  ย  ย  ย  ย โ•‘ โ•šโ•โ•โ•โ•โ•โ•โ•โ•โ•โ•โ•โ•โ•โ•โ•โ•โ•โ•โ•โ•โ•โ•โ•โ•โ•โ•โ•โ•โ•โ•โ•โ•โ•โ•โ•โ•โ•โ•โ•โ•โ•โ•โ•โ•โ•โ•โ•โ•โ•โ•โ•โ•โ•โ•โ•โ•โ•โ•โ•โ•โ•โ•โ•โ•โ•โ• [1] 📊 MARKET SNAPSHOT & BIAS ------------------------------------------------------------------- โ€ข Asset / Pair : 🪙 XAUUSD (Gold / US Dollar) โ€ข Live Reference : 💵 4,163.43 โ€ข Primary Macro Bias : 🐻 BEARISH (4H Frame) โ€ข Intermediate Bias : 📉 BEARISH (1H Frame) โ€ข Intraday Execution : ⚡ BEARISH (15M Frame) โ€ข 4H RSI : ⚖️ 50 (Neutral Consolidation) โ€ข Key Decision Zone : 🛡️ 4,067 โ€“ 4,201 [2] 🌐 MULTI-TIMEFRAME ALIGNMENT ------------------------------------------------------------------- โ€ข 4H Horizon : 🔻 Bearish trend, sideways market structure. Buy Score: 20 | Sell Score: 40. โ€ข 1H Horizon : 🌊 Bearish consolidation, RSI at 46. Trading below key overhead resistance. โ€ข 15M Horizon : ⏱️ Bearish short-term, RSI at 55. Buy Score: 30 | Sell Score: 65. [3] 🔑 KEY PRICE LEVELS ------------------------------------------------------------------- โ€ข Major Resistance : 🧱 4,201 (4H / 1H Macro Ceiling) โ€ข Intraday Resistance : 🚧 4,167 (15M Immediate Overhead) โ€ข Live Price : 🪙 4,163.43 โ€ข Immediate Support : 🛋️ 4,158 (15M Short-term Floor) โ€ข Intermediate Sup. : 🪜 4,147 (1H Support) โ€ข Major Support Base : 🏛️ 4,067 (4H Macro Structural Floor) [4] 📈 SCENARIO ANALYSIS ------------------------------------------------------------------- โ€ข BEARISH CONTINUATION (🎯 Preferred Setup) -> Overhead resistance holds firm below 4,167. -> Break below 4,158 targets 4,147 and major 4,067 floor. โ€ข BULLISH REBOUND / BREAKOUT (🔄 Alternative) -> Buyers reclaim and sustain price above 4,167. -> Upside expansion toward 4,201 macro resistance ceiling. โ€ข CONSOLIDATION RANGE (⏸️ Neutral) -> Range-bound chop between 4,158 and 4,167. -> Wait for clear edge test/breakout trigger before entering. [5] 🛠️ TRADER EXECUTION FRAMEWORK ------------------------------------------------------------------- โ€ข Primary Direction : 📉 Short setups on rallies / Breakdowns on volume โ€ข Execution Zone : 🎯 4,158 โ€“ 4,167 corridor โ€ข Invalidation / SL : 🛑 Strict stop-loss placement above 4,167 โ€ข Risk Note : ⚠️ Sideways structure + neutral 4H RSI (50) require strict position sizing and patience. =================================================================== 🔗 Source: https://forexdevice.com/xauusd-technical-analysis-14-october-2026/ ===================================================================
0 0
๐Ÿ‡บ๐Ÿ‡ธ Sam
2026-10-13 02:26:13
🟡 XAUUSD Institutional Market Report & Technical Analysis โ€” October 13, 2026 ============================================================== Live Price Reference: 4,169.16 USD Overall Market Bias: Mixed / Cautious Consolidation 📊 Multi-Timeframe Structure & Bias โ€ข 4H Macro Trend: Bearish (RSI: 52 | Market Structure: Sideways) โ€ข 1H Tactical Trend: Bullish (RSI: 47 | VWAP: Above) โ€ข 15M Execution View: Bearish / Neutral (Buy/Sell Score: 40/40) 🔑 Key Price Levels to Watch โ€ข 4H Macro Resistance Ceiling: 4,217 โ€ข 15M Immediate Resistance Hurdle: 4,176 โ€ข Current Market Price: 4,169.16 โ€ข 15M Immediate Support Floor: 4,163 โ€ข 1H Support Baseline: 4,155 โ€ข 4H Major Support Base: 4,067 💡 Trader Decision Framework & Outlook โ€ข Market Condition: Gold is currently trading in a tight consolidation corridor between lower-timeframe support and overhead resistance as market participants weigh short-term recovery attempts against macro bearish pressure. โ€ข Bullish Trigger: Clean breakout and acceptance above 4,176 to open the path toward the macro 4,217 ceiling. โ€ข Bearish Trigger: A breakdown below execution support at 4,163 and the 4,155 baseline. โ€ข Preferred Approach: Exercise patience, trade range boundaries, or wait for confirmed breakout triggers with strict risk management. 🔗 Read the complete detailed report & charts here: https://forexdevice.com/xauusd-technical-analysis-13-october-2026/ #XAUUSD #GoldTrading #TechnicalAnalysis #ForexSignals #TradingView #MarketUpdate #ForexDevice
3 0
๐Ÿ‡บ๐Ÿ‡ธ Sam
2026-10-12 14:29:53
============================================= [FORUM POST] XAUUSD Technical Outlook & Key Levels ============================================= Hey Community, Here is the latest intraday breakdown for XAUUSD (Gold) on the M15 chart. Price is currently consolidating after reaching recent highs. ----------------------------------------------- 1. CURRENT MARKET CONTEXT ----------------------------------------------- โ€ข Current Price : ~4165.35 โ€ข Timeframe : M15 (15-Minute) โ€ข Trend State : Intraday Pullback / Short-Term Bearish Correction โ€ข Context : Price rejected off top resistance near 4218.50 and is now testing local demand levels. -------------------------------------------------------- 2. KEY TECHNICAL LEVELS TO WATCH -------------------------------------------------------- [RESISTANCE ZONES] โ€ข R3: 4218.50 (Recent High / Major Resistance) โ€ข R2: 4202.30 (Breakout Pivot) โ€ข R1: 4186.10 (Immediate Overhead Resistance) [SUPPORT ZONES] โ€ข Current Level: ~4165.35 โ€ข S1: 4161.70 (Immediate Intraday Support) โ€ข S2: 4145.50 (Key Liquidity Zone) โ€ข S3: 4129.30 (Lower Demand Support) -------------------------------------------------- 3. POTENTIAL TRADE SCENARIOS -------------------------------------------------- [BULLISH CONTINUATION] โ€ข Needs a clear reclamation and candle close above 4186.10. โ€ข Target 1: 4202.30 โ€ข Target 2: 4218.50 [BEARISH BREAKDOWN] โ€ข A sustained break below 4161.70 opens downside momentum. โ€ข Target 1: 4145.50 โ€ข Target 2: 4129.30 -------------------------------------------------------------------------------- 4. ENGINE VOLATILITY & METRICS (GoldPulse PRO) -------------------------------------------------------------------------------- โ€ข Dynamic Breakout Range : 178.1 pips (High Intraday Volatility) โ€ข Trailing Activation : 100.0 pips โ€ข Trail Lock Distance : 80.0 pips -------------------------------------------------------------------------------- What are your targets for Gold today? Are you looking for a bounce at 4161 or waiting for a deeper dip? Drop your thoughts below!
0 0
...