
Calculating Lot Sizes, Pips, and Profits
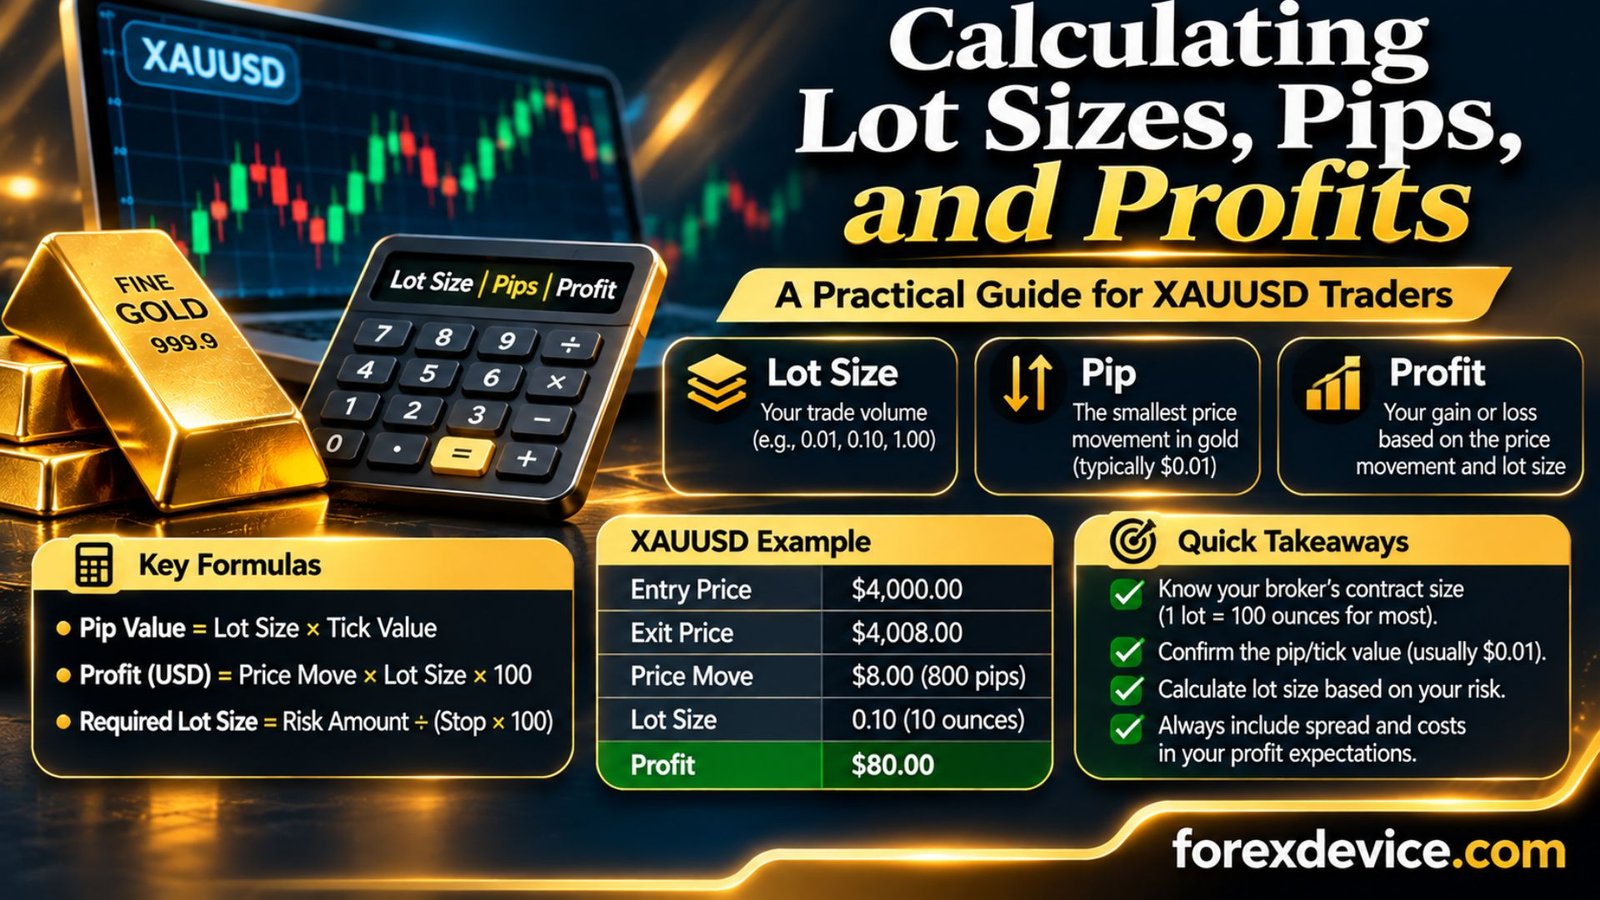
Calculating Lot Sizes, Pips, and Profits
Before opening a gold trade, every XAUUSD trader should be able to answer three questions: How much gold does this position represent? How much money will be gained or lost if the price moves by one dollar? And how large can the position be without exceeding the planned risk?
These questions are fundamental to position sizing, yet they are often misunderstood because trading platforms display volume in lots rather than ounces, brokers use different price increments, and the meaning of a pip in gold trading is not standardized across the industry.
This guide explains XAUUSD lot sizes, pip values, profit calculations, and risk-based position sizing with practical examples that can be checked using ordinary arithmetic.
Understanding Gold Lot Sizes: What Does 0.01 Lot Actually Mean?
A lot is a standardized trading-volume unit used by brokers and trading platforms. In XAUUSD trading, it determines how many troy ounces of gold are represented by a position.
On many retail gold CFD accounts, one standard lot represents 100 troy ounces. Under this specification, a position of 0.10 lots represents 10 ounces, and 0.01 lots represents one ounce.
However, the definition is not universal. Brokers can offer different contract sizes, symbol variants, or account structures. Always verify the actual specification before applying any calculation.
| Lot Size | Gold Exposure | P/L for a $1 Move |
|---|---|---|
| 0.01 | 1 ounce | $1 |
| 0.02 | 2 ounces | $2 |
| 0.05 | 5 ounces | $5 |
| 0.10 | 10 ounces | $10 |
| 0.50 | 50 ounces | $50 |
| 1.00 | 100 ounces | $100 |
The table assumes 100 ounces per lot, a USD-denominated account, and a one-dollar-per-ounce price movement. The profit or loss amounts exclude spreads, commissions, swaps, and slippage.
Why a small lot can still create meaningful exposure
Imagine gold is trading at $4,000 per ounce. A 0.10-lot position representing 10 ounces has a notional market value of approximately $40,000.
The trader may not need $40,000 in available cash to open the position because a leveraged CFD account typically requires margin rather than full notional payment. Nevertheless, the price exposure remains based on the full 10 ounces.
A $20 adverse movement would therefore produce approximately $200 of price-related loss before trading costs.
This distinction between margin required and actual financial exposure is essential when evaluating risk.
Why Broker Contract Specifications Must Be Checked First
Before calculating profits, confirm the symbol’s contract size, tick size, tick value, minimum trading volume, and volume step.
In MetaTrader 4 or MetaTrader 5, these details can generally be found through the symbol’s specification or properties window, although the exact interface differs by platform and broker.
Important fields to understand
- Contract size: The quantity of gold represented by one lot.
- Minimum volume: The smallest position the broker permits.
- Volume step: The increment by which trading volume can increase.
- Tick size: The minimum permitted price increment for the symbol.
- Tick value: The monetary value of one tick movement for a specified trading volume, often reported per lot.
- Digits and point: The quotation precision and platform point size.
Some brokers display tick values in the account currency, while platform calculations may distinguish profit and loss tick values. Currency conversion and instrument-specific calculation modes can also affect the result.
Important: Never assume that the lot size, pip value, or tick value from another trader’s screenshot applies to your own XAUUSD symbol. Even accounts at the same broker may have different symbol specifications.
For unusual symbols or account currencies, the platform’s own profit-calculation functions can provide a more reliable cross-check than a generic online lot calculator.
Gold Pips, Points, and Ticks: Understanding the Difference
One of the most frequent sources of confusion in XAUUSD trading is the meaning of a pip.
In major forex currency pairs, pip conventions are relatively standardized. Gold CFDs are different: brokers and trading communities may describe price increments using different pip definitions.
For that reason, a statement such as “gold moved 100 pips” is incomplete unless the price increment represented by one pip is defined.
Points depend on the symbol’s quotation precision
Suppose gold is quoted as 4000.25 with two decimal places. One platform point is normally 0.01.
If the quotation uses three decimal places, such as 4000.250, one platform point is normally 0.001.
| Price Movement | Points at 0.01 | Points at 0.001 |
|---|---|---|
| $0.10 | 10 | 100 |
| $0.50 | 50 | 500 |
| $1.00 | 100 | 1,000 |
| $5.00 | 500 | 5,000 |
| $10.00 | 1,000 | 10,000 |
The table assumes the platform point matches the displayed decimal precision. The actual tick size can differ from the point size, so the symbol specification remains authoritative.
Calculating tick value
For a straightforward USD-quoted gold contract, the theoretical tick value can be calculated as:
Tick Value Formula
Tick value = Contract size × Tick size × Lots
Example: 100 ounces × $0.01 × 0.10 lots = $0.10 per tick.
Under these assumptions, a $1 gold price movement equals 100 ticks of $0.01 each, producing a $10 profit or loss for a 0.10-lot position.
For a non-USD account or an instrument with different contract mechanics, account-currency conversion and broker calculation rules must also be considered.
The Core Formula for Calculating XAUUSD Profit and Loss
For a conventional linear gold contract quoted in USD per ounce, the gross profit or loss depends on three quantities: the entry-to-exit price difference, the number of ounces represented by one lot, and the position’s lot size.
Gross Profit or Loss — Buy Position
(Exit price − Entry price) × Contract size × Lots
A positive result represents a gross profit; a negative result represents a gross loss.
Gross Profit or Loss — Sell Position
(Entry price − Exit price) × Contract size × Lots
For a sell position, falling prices create a positive gross result, while rising prices create a negative result.
These formulas assume entry and exit prices are the actual executed prices, so the bid/ask difference is already reflected in them. Do not deduct the spread again when using actual fills.
Commissions, swaps, and other separately charged costs must still be included to calculate net profit or loss.
Worked Examples: Calculating Profits on Buy and Sell Trades
Example A — Profitable Gold Buy
A trader opens a 0.05-lot XAUUSD buy position at an executed ask price of $4,000.50. The broker’s contract size is 100 ounces per lot.
The position is later closed at an executed bid price of $4,012.50.
- Gold exposure: 0.05 × 100 = 5 ounces
- Price difference: $4,012.50 − $4,000.50 = $12
- Gross profit: $12 × 5 = $60
Because the calculation uses executed ask and bid prices, the spread’s effect is already included in the price difference.
Example B — Losing Gold Sell
A trader sells 0.10 lots at an executed bid price of $3,995.00 and later closes at an executed ask price of $4,003.00.
- Gold exposure: 0.10 × 100 = 10 ounces
- Adverse price movement: $8 per ounce
- Gross loss: $8 × 10 = $80
The example demonstrates that a short position loses money when its closing ask price is above the opening bid price.
Example C — A Small Price Move on a Large Position
Suppose a trader holds 1.00 lot, representing 100 ounces. Gold moves $2 against the position.
The gross loss is $2 × 100 ounces = $200.
With a 0.01-lot position representing one ounce, the same $2 movement would produce a gross loss of approximately $2.
The price movement is identical. The financial impact differs because the position sizes differ.
These examples show why lot size should never be selected solely on the basis of confidence in a trade direction.
How to Calculate Lot Size From Account Risk
Risk-based position sizing starts with the maximum financial loss the trader plans to accept if the trade reaches its stop-loss, rather than with the largest volume the broker permits.
A trader might define risk as a percentage of account equity or as a fixed monetary amount. There is no universally appropriate percentage for every trader or strategy.
Calculate the monetary risk budget
Risk Budget
Planned risk = Account equity × Risk percentage
Example: $5,000 × 0.5% = $25.
The next step is to calculate how much one lot would lose if the planned stop distance is reached.
Position Sizing Formula
Lots = Risk budget ÷ (Stop distance × Contract size)
This simplified formula applies when the stop distance is measured in USD per ounce, the contract is linear, and the account is USD-denominated. Allowance for trading costs is required.
Example — A $5,000 Account With a $5 Stop
Assume the following:
- Account equity: $5,000
- Planned risk: 0.5%, equivalent to $25
- Stop distance: $5 per ounce
- Contract size: 100 ounces per lot
Lot size = $25 ÷ ($5 × 100) = 0.05 lots.
At 0.05 lots, the position represents five ounces, and a $5 adverse price movement would produce approximately $25 of gross loss.
The calculated volume must be checked against the broker’s minimum volume and volume step. If the result falls between permitted increments, rounding down may help keep the planned exposure within the risk budget.
However, actual stop execution can differ from the specified level. Slippage, gaps, commissions, and currency conversion may cause the final loss to exceed the planned amount.
How Stop-Loss Distance Changes the Correct Lot Size
A common beginner mistake is choosing a fixed lot size for every trade without considering the stop-loss distance.
Two trades with identical lot sizes can have very different potential losses if one uses a $3 stop and the other uses a $15 stop.
Risk-based sizing generally requires a smaller position when the stop is farther from the entry.
| Stop Distance | Risk Budget | Calculated Lot Size |
|---|---|---|
| $2.50 | $25 | 0.10 |
| $5.00 | $25 | 0.05 |
| $10.00 | $25 | 0.025 |
| $12.50 | $25 | 0.02 |
| $25.00 | $25 | 0.01 |
These theoretical calculations assume a 100-ounce contract and exclude costs. A broker with a 0.01-lot volume step would not permit a 0.025-lot order; the trader would need to use a valid lower volume or reconsider the setup.
Why the stop should be selected before the lot size
The stop-loss should reflect where the trading idea becomes invalid or another documented exit condition applies. It should not be arbitrarily moved closer merely to justify a larger position.
Traders may use structural levels, volatility measures such as Average True Range (ATR), or other tested exit rules.
After identifying the stop, calculate the volume that fits the financial risk budget. If the broker’s minimum position would exceed that budget, skipping the trade may be more appropriate than forcing an unsuitable position size.
Including Spreads, Commissions, and Account Currency
A correct gross profit calculation is not necessarily the same as the final account result.
Net profit or loss can be affected by separately charged commissions, overnight financing, currency conversion, and execution slippage.
Understanding the spread’s role
When calculating a trade using actual executed entry and exit prices, the bid/ask spread is already incorporated in the price difference.
When estimating a future trade using a single reference price, however, traders must account for the expected difference between buying at the ask and selling at the bid.
For a detailed explanation, read Understanding Bids, Asks, and Spreads.
Net profit example
From Gross Profit to Net Profit
Suppose a completed trade produces $60 of gross profit calculated from its actual fills.
- Gross profit: $60.00
- Round-trip commission: $3.50
- Overnight financing: $0.00
- Other separately charged costs: $0.00
The spread is not deducted again because the actual executed prices already reflect it.
What if the account currency is not USD?
Gold is commonly quoted in US dollars per ounce. If the account is denominated in EUR, GBP, INR, or another currency, the platform may need to convert the USD-denominated trading result into the account currency.
The conversion rate, calculation method, and applicable fees can affect the final result.
For non-USD accounts, use the broker’s symbol specification and platform profit calculator to verify monetary risk rather than assuming that one dollar of XAUUSD profit equals one unit of the account currency.
Seven Lot Size and Profit Calculation Mistakes to Avoid
- Assuming every broker uses 100 ounces per lot. Contract specifications must be checked for the actual symbol.
- Confusing pips with points. XAUUSD pip terminology varies, and platform points depend on quotation precision.
- Choosing volume from available margin. Margin availability does not determine how much loss a trader can afford.
- Ignoring the stop-loss distance. A larger stop generally requires a smaller position for the same planned risk.
- Rounding lot size upward. Increasing the calculated volume to fit a broker’s volume step can exceed the intended risk budget.
- Deducting the spread twice. Profit calculated from actual executed bid/ask prices already reflects the spread.
- Ignoring account-currency conversion. USD-denominated gold profit may need conversion before it appears in the account balance.
These mistakes can affect manual traders and automated systems alike. Even a mathematically sound trading strategy can produce unexpected exposure when contract specifications or unit conventions are misunderstood.
A Practical XAUUSD Position-Sizing Workflow
Before entering a gold trade, follow a consistent sequence that connects the trading idea to the financial exposure.
- Identify the trading setup. Define the entry conditions and the price that invalidates the idea.
- Determine the stop distance. Measure the difference between the expected executed entry and the intended stop level.
- Set a monetary risk budget. Decide how much account equity the planned trade may put at risk.
- Verify the symbol specifications. Check contract size, tick size, tick value, and volume increments.
- Calculate the position size. Use the risk budget and stop distance, including an allowance for trading costs.
- Check existing exposure. Account for other positions and any combined risk limits.
- Validate the order. Confirm volume, entry, stop-loss, margin requirements, and the platform’s estimated profit or loss before submission.
Risk reminder: A calculated position size estimates the loss at a specified exit price. It does not guarantee a maximum loss. Market gaps, slippage, and execution conditions can produce a worse fill.
Once a trader can perform these calculations reliably, the same principles can be incorporated into a written trading plan or automated risk-management process.
Frequently Asked Questions
How much is 0.01 lot in XAUUSD?
On a broker where one standard lot represents 100 ounces, 0.01 lot represents one ounce. A $1 gold price movement would then produce approximately $1 of gross profit or loss. Always verify the broker’s contract size.
How much profit is 100 pips in gold?
It depends on the broker’s pip definition, contract size, and trading volume. Because gold pip conventions vary, convert the stated pip movement into an actual price difference before calculating profit.
How much does 0.10 lot make when gold moves $10?
Assuming 100 ounces per lot, 0.10 lot represents 10 ounces. A favorable $10-per-ounce move produces $100 of gross profit before separately charged fees.
What lot size should I use for a $1,000 account?
Account balance alone is insufficient to determine a suitable lot size. The calculation also requires a defined risk budget, stop distance, contract specification, trading costs, and consideration of existing exposure.
Does higher leverage increase the profit per lot?
No. For the same contract size, volume, and price movement, the gross profit or loss remains the same. Higher leverage generally reduces the margin required, potentially making larger positions accessible.
Can I calculate gold profits without knowing pip values?
Yes. For a conventional linear XAUUSD contract, multiply the actual entry-to-exit price difference by the contract size and lot volume. This avoids ambiguous pip terminology.
Why does my MetaTrader profit differ from my calculation?
Possible reasons include the actual bid/ask fills, commissions, swaps, account-currency conversion, symbol contract specifications, or differences between requested and executed prices.
Final Takeaways: Calculate the Risk Before the Trade
Lot size is not simply a setting in a trading platform. It determines how strongly each price movement affects the account.
For many conventional XAUUSD contracts, profit and loss can be estimated from the price difference, contract size, and number of lots. Yet traders must confirm the broker’s specifications, distinguish points from pips, and include realistic execution costs.
Risk-based position sizing connects these calculations to a defined financial limit. Rather than selecting the largest affordable position, traders first identify the stop-loss and planned monetary risk, then calculate a compatible trading volume.
These principles apply whether gold positions are opened manually, through MetaTrader, or by an automated Expert Advisor. The objective is not to predict profits with certainty, but to understand the potential financial consequences of each trade before entering the market.
Sources & Further Reading
- CME Group — Position and Risk Management
Educational guidance on position sizing, market exposure, and managing trading risk. - MetaTrader 5 — Financial Instrument Specification
Official platform documentation covering contract size, tick size, tick value, and other instrument properties. - MetaTrader 5 — Trading Operations
Official documentation explaining trading operations and platform order mechanics.