XAUUSD Technical Analysis & Structural Outlook
01 Multi-Timeframe Structural Assessment
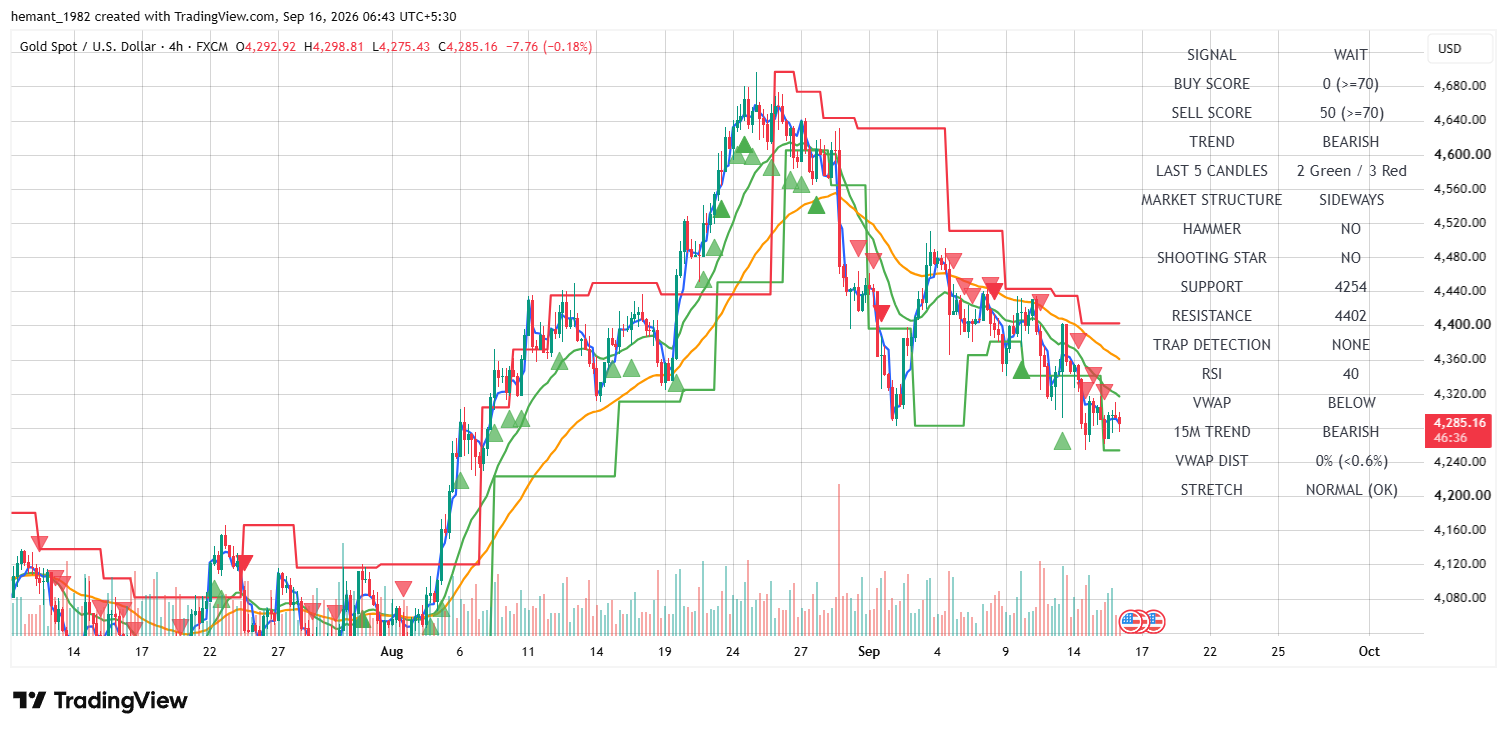
Cross-timeframe alignment displays a unified bearish trend structure: 15M bearish momentum → 1H bearish continuation → 4H macro bearish filter.
Price action reflects active seller control across horizons, keeping technical indicators directed downward while lower timeframes seek intermediate floors.
With the 4H RSI holding at 40, downside momentum remains active, leaving room for further test of macro support zones if selling pressure persists.
Traders should manage risk carefully around immediate resistance barriers where macro sellers continue to defend.
02 4H Institutional View
The 4H timeframe outlines the macro structural picture, with XAUUSD trading near 4,285.16 under a BEARISH trend classification.
The 4H RSI reads 40, reflecting persistent downward pressure. Buy score registers 0 while sell score stands at 50.
Structural support is established near 4,254, while macro resistance ceiling is pinned at 4,402.
Sustained trade below key moving averages and VWAP preserves the broader bearish bias.
03 1H Tactical Structure
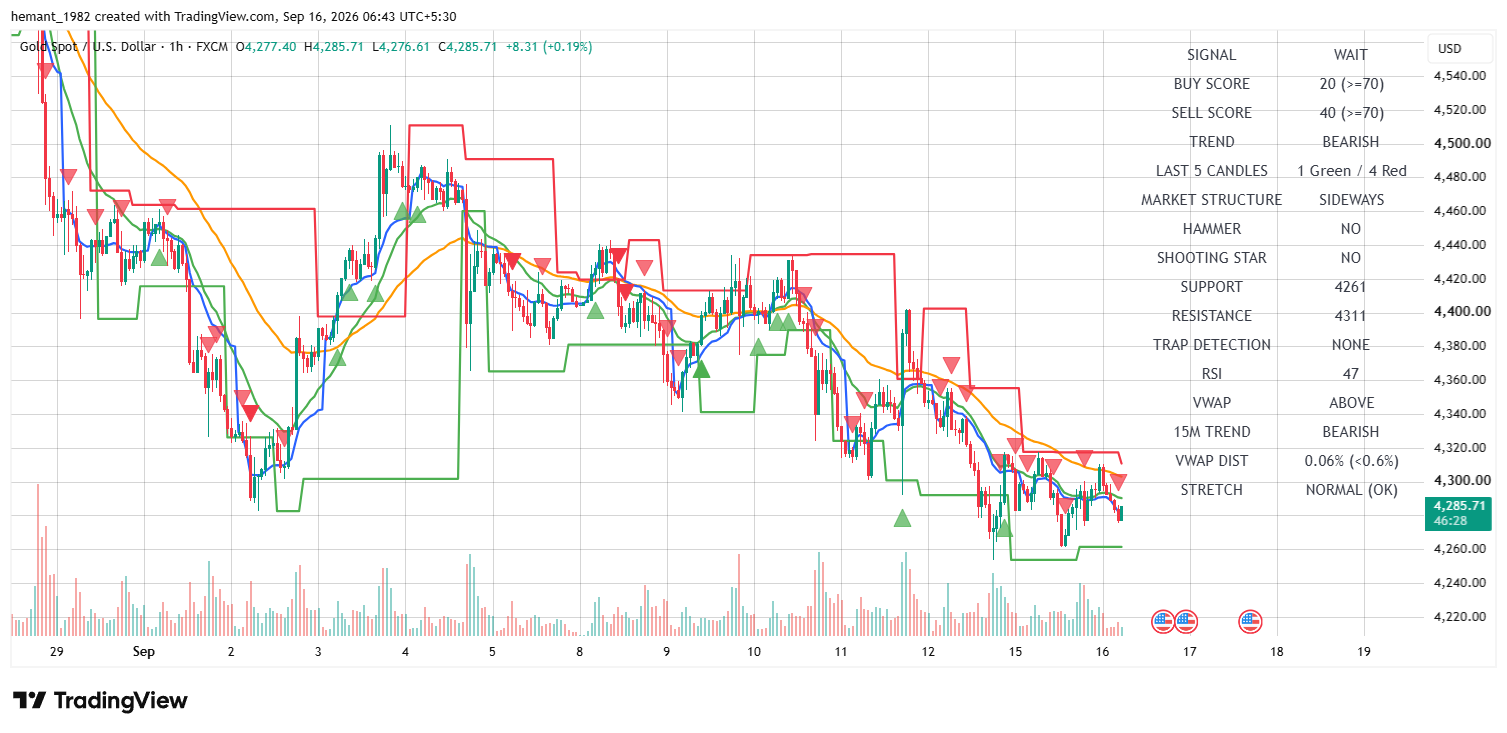
The 1H chart holds a BEARISH trend label, with the RSI printing at 47.
Recent candle structure reflects seller dominance (1 Green / 4 Red), highlighting steady intermediate correction.
Immediate 1H support is marked at 4,261, while tactical overhead resistance stands near 4,311.
Maintaining position below overhead resistance preserves the active intermediate downside setup.
04 15M Execution View
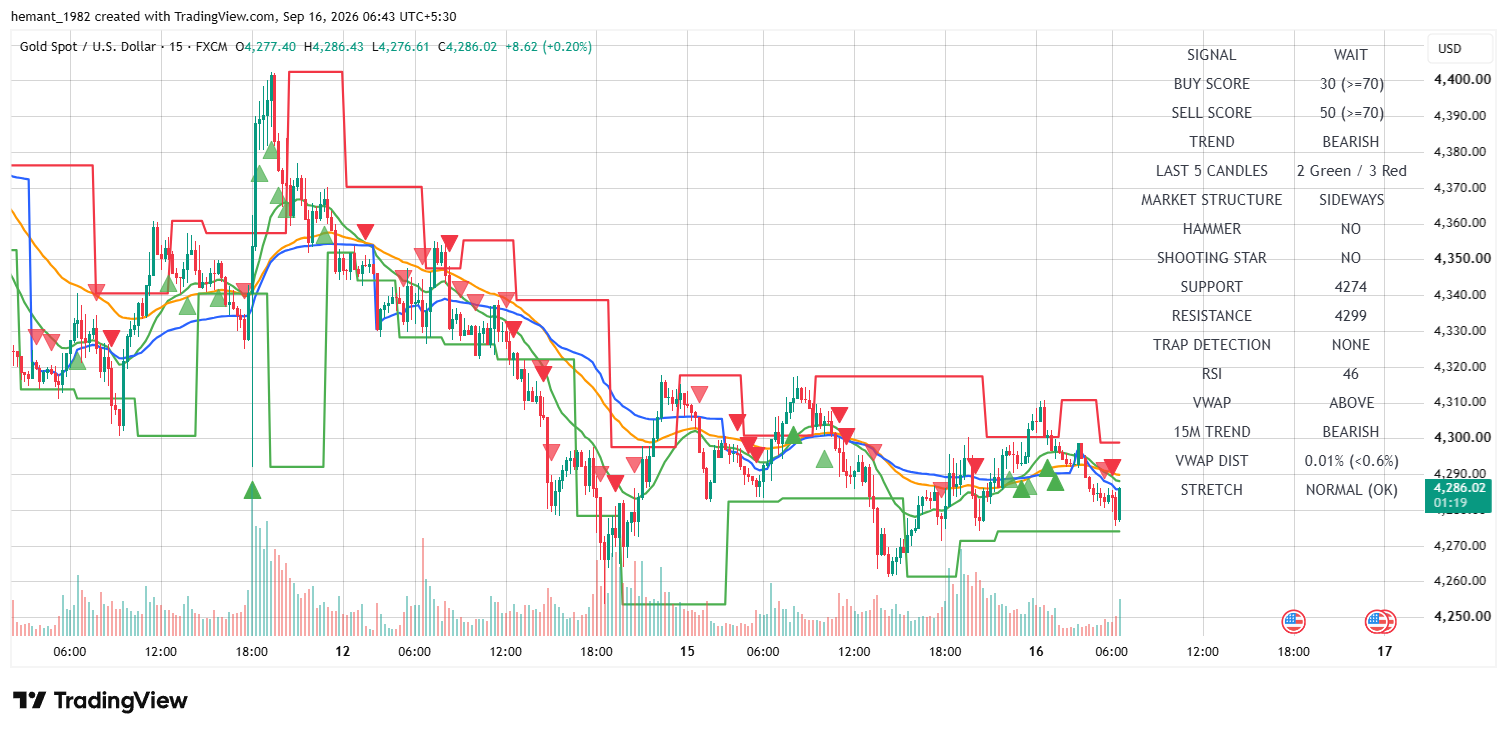
The 15M execution timeframe registers a BEARISH trend condition with a Buy Score of 30 and a Sell Score of 50.
The RSI reads 46, reflecting steady short-term downward momentum.
The immediate tactical corridor is bounded by support at 4,274 and resistance at 4,299. Price is trading live near 4,285.16 within this channel.
Holding below 4,299 confirms ongoing downside pressure, whereas a breakdown below 4,274 targets lower supports.
05 Key Price Levels & Market Map
| Level | Role | Technical Interpretation |
|---|---|---|
| 4,254 | 4H Major Support Base | Macro floor establishing key structural defense. |
| 4,261 | 1H Support Level | Critical intermediate baseline supporting the current range. |
| 4,274 | 15M Immediate Support | Short-term floor holding recent intraday pullbacks. |
| 4,299 | 15M Immediate Resistance | Immediate overhead hurdle capping short-term recovery. |
| 4,285.16 | Current Market Price | Live trading reference evaluating immediate session positioning. |
| 4,402 | 4H Major Resistance | Macro higher-timeframe resistance ceiling for trend reversal. |
06 Scenario Analysis
07 Trader Decision Framework
08 Final Institutional Outlook
XAUUSD exhibits a unified bearish structural posture across all timeframes, trading near 4,285.16. The 4H timeframe maintains a bearish stance (RSI 40, sell score 50), while the 1H timeframe confirms intermediate bearish continuation (RSI 47) and the 15M execution view displays active selling momentum with a sell score of 50 and RSI at 46.
Market participants should monitor key tactical boundaries between 4,274 and 4,299 . Holding below resistance keeps downside continuation active toward macro support floors.
Strict adherence to risk controls and disciplined stop-loss placement remain vital during active trend phases.
💬 XAUUSD TRADER DISCUSSIONS
Real-time execution setups & analysisPrice: $4,171.40
Bias: Short-Term Bullish (Lower TF) / Bearish (4H Macro)
Key Levels:
• Resistance: 4,146 / 4,184
• Support: 4,121 / 4,106
Quick Strategy:
Short-term momentum favors buying dips while price holds above the 4,106–4,121 support zone, targeting a push toward 4,184. Watch out for overextended RSI.
Full report: https://forexdevice.com/xauusd-technical-analysis-09-october-2026/
Hello community! Here is the latest breakdown for XAU/USD based on current 15M market structure and momentum indicators.
Market Overview:
• Current Price: 4,124.03
• Trend: Bullish / Sideways Consolidation
• RSI: 51 (Neutral)
• VWAP: Above
Actionable Trade Setups:
Setup 1: Bullish Bounce (Long)
• Entry Zone: 4,118.00 - 4,122.00 (On minor dip to support)
• Stop Loss (SL): 4,108.00
• Take Profit (TP1): 4,133.00
• Take Profit (TP2): 4,145.00
Setup 2: Bearish Breakdown (Short)
• Entry Zone: Bearish close below 4,110.00
• Stop Loss (SL): 4,118.00
• Take Profit (TP): 4,098.00 - 4,100.00
Community Discussion: Are you playing the range breakout or waiting for a deeper pullback to support? Drop your thoughts below!