
XAUUSD Technical Analysis — 20 November 2026
XAUUSD Technical Analysis & Structural Outlook
The recorded timeframes show mixed direction; confirmation is important. The 4H RSI is oversold, so a relief bounce remains possible even during a downtrend. Recorded XAUUSD reference: $3,574.21. Decision area: Reference band spanning saved price · $3,560.00–$3,600.00. These are historical chart readings, not a live quote.
TRADER BOTTOM LINE: Use 4H for directional context, 1H for confirmation and 15M for execution conditions. Reassess on fresh candles; a historical level or RSI reading alone does not confirm an entry.
Market structure · at a glance
| Timeframe | Direction | RSI | Momentum | Structure |
|---|---|---|---|---|
| 4H · Primary | Bearish | 21.37 | Oversold | Persistent Lower Highs And Lows |
| 1H · Tactical | Bearish | 35.99 | Between 30 and 70 | Bearish Structure With Corrective Rebound |
| 15M · Execution | Neutral | 49.36 | Between 30 and 70 | Recovery Followed By Sideways Consolidation |
Use the 4H trend for context, the 1H chart for confirmation and the 15M chart to assess execution conditions.
The latest saved session drives the executive brief above. Earlier sessions remain accessible below. Price changes compare recorded snapshots, not continuous market returns.
New York Session · Latest20 Nov 2026, 12:33 UTC · Bearish · View charts and analysis
New York — Recorded Chart Review
XAUUSD enters the New York reporting session with a prevailing bearish structure despite a modest recovery from recent intraday lows. The four-hour chart continues to exhibit lower highs and lower lows, while its RSI at 21.37 highlights deeply oversold momentum. The hourly RSI has recovered to 35.99, reflecting a corrective rebound rather than a confirmed reversal. Elevated selling activity during the preceding decline reinforces the importance of monitoring overhead supply.
On the 15-minute chart, price is consolidating near 3574 after recovering from the 3520–3540 region. The immediate decision zone spans 3560–3600, with resistance concentrated around 3580 and 3600. Sustained acceptance above 3600 could support an extension toward 3625–3650. Conversely, rejection beneath 3580 followed by a break below 3560 would increase the likelihood of renewed selling pressure toward 3540, 3520 and potentially 3500.
View Detailed Technical Analysis 4H / 1H / 15M, price levels & scenarios
Multi-timeframe structural assessment
| Horizon | Trend | RSI | Momentum condition | Reference |
|---|---|---|---|---|
| 4H · Primary | Bearish | 21.37 | Oversold | $3,600.00 |
| 1H · Tactical | Bearish | 35.99 | Between 30 and 70 | $3,580.00 |
| 15M · Execution | Neutral | 49.36 | Between 30 and 70 | $3,575.00 |
Direction and market structure are separate chart labels. A bearish trend with a sideways structure label is possible; neither label independently confirms a trade.
4H · Institutional structure
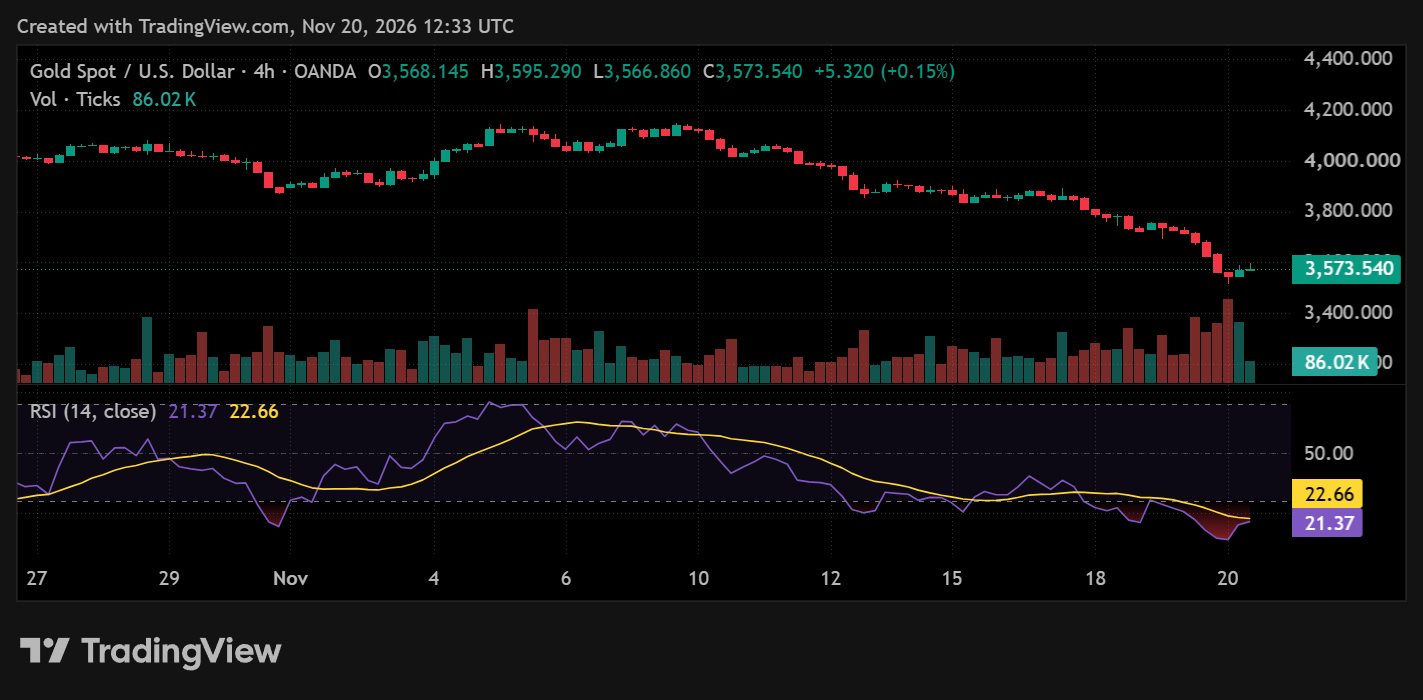
Technical reading: The 4H chart has a bearish trend classification and RSI 21.37. Momentum is oversold; a rebound is possible, but RSI alone cannot confirm a reversal.
Price reference: $3,600.00. Confirm acceptance or rejection on completed candles; the chart reference is not an automatic entry signal.
1H · Tactical confirmation
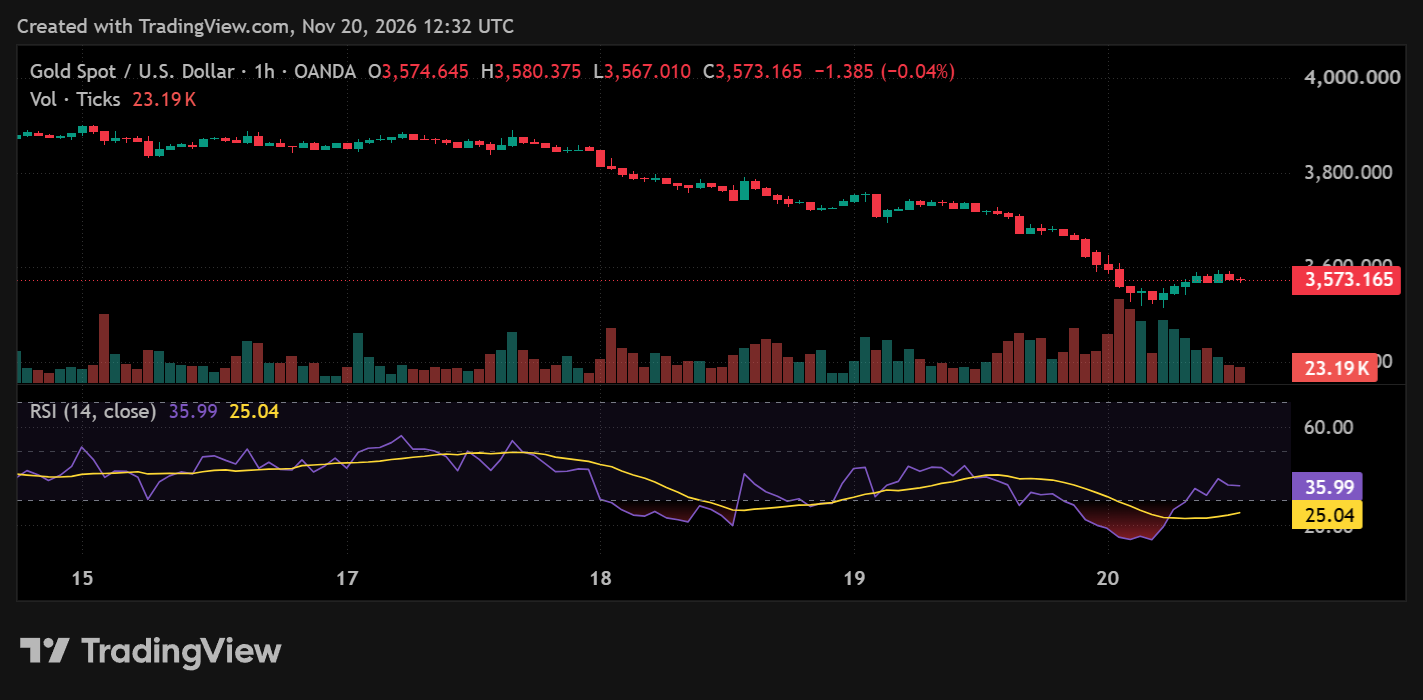
Technical reading: The 1H chart has a bearish trend classification and RSI 35.99. RSI is outside conventional extreme zones; watch for directional follow-through and confirmed swing structure.
Price reference: $3,580.00. Confirm acceptance or rejection on completed candles; the chart reference is not an automatic entry signal.
15M · Execution context
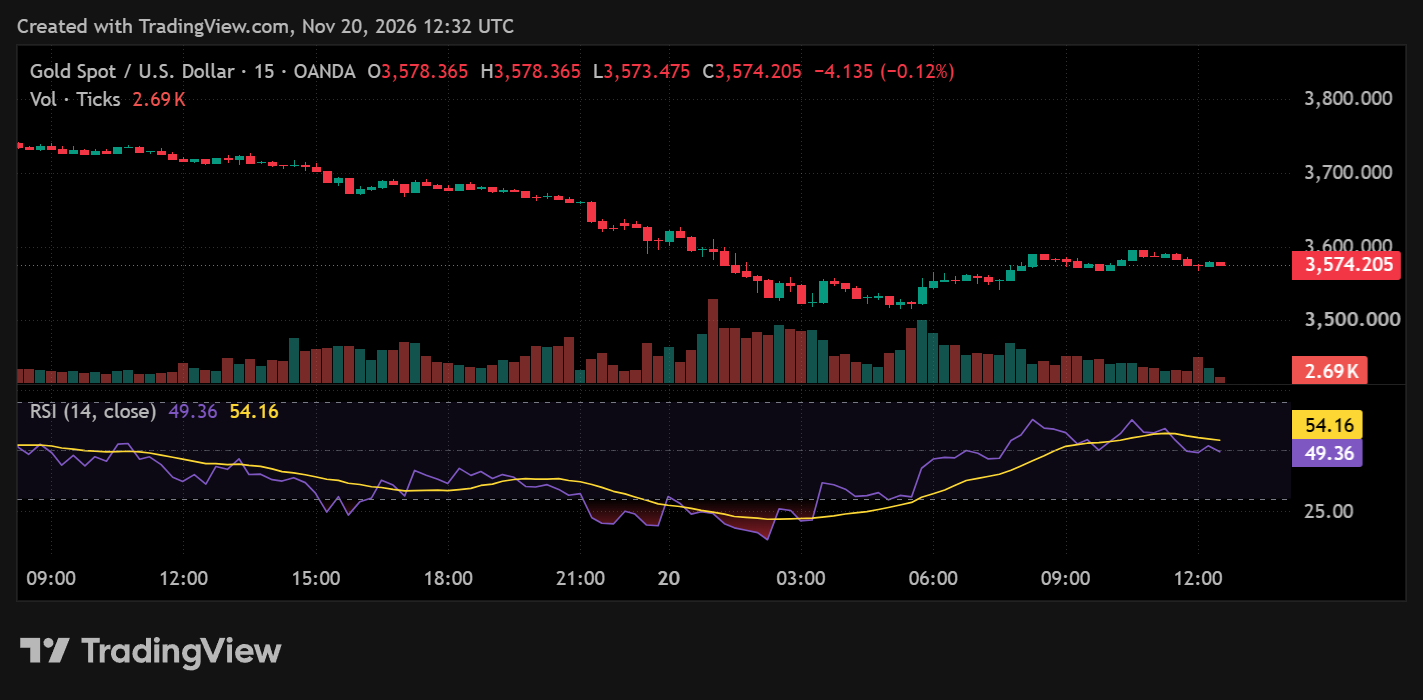
Technical reading: The 15M chart has a neutral trend classification and RSI 49.36. RSI is outside conventional extreme zones; watch for directional follow-through and confirmed swing structure.
Price reference: $3,575.00. Confirm acceptance or rejection on completed candles; the chart reference is not an automatic entry signal.
Key price levels & structural map
Recorded chart levels are sorted by price, not by indicator category. Levels above the saved price are overhead references; they are not confirmed active support.
| Price | Chart source | Relative to saved price | Trader interpretation |
|---|---|---|---|
| $3,450.00 | Support · timeframe unspecified | Below · $124.21 away | Potential lower reference; confirm it still holds. |
| $3,500.00 | Support · timeframe unspecified | Below · $74.20 away | Potential lower reference; confirm it still holds. |
| $3,520.00 | Support · timeframe unspecified | Below · $54.20 away | Potential lower reference; confirm it still holds. |
| $3,540.00 | Support · timeframe unspecified | Below · $34.20 away | Potential lower reference; confirm it still holds. |
| $3,560.00 | Support · timeframe unspecified | Below · $14.20 away | Potential lower reference; confirm it still holds. |
| $3,580.00 | Resistance · timeframe unspecified | Above · $5.80 away | Overhead resistance; monitor the reaction on approach. |
| $3,600.00 | Resistance · timeframe unspecified | Above · $25.80 away | Overhead resistance; monitor the reaction on approach. |
| $3,625.00 | Resistance · timeframe unspecified | Above · $50.80 away | Overhead resistance; monitor the reaction on approach. |
| $3,650.00 | Resistance · timeframe unspecified | Above · $75.80 away | Overhead resistance; monitor the reaction on approach. |
| $3,700.00 | Resistance · timeframe unspecified | Above · $125.80 away | Overhead resistance; monitor the reaction on approach. |
Nearest recorded overhead reference: $3,580.00 (5.80 above the saved price).
Bullish, bearish & no-trade scenarios
Watch: A reclaim of an overhead reference with improving 15M and 1H structure.
Invalidation: A failed reclaim or a fresh confirmed lower low.
Watch: Rejection at overhead references and renewed lower highs/lows on completed candles.
Invalidation: Sustained acceptance above a relevant structural reference.
Watch: No confirmed setup, stretched momentum or conflicting chart signals.
Invalidation: A clear breakout/retest with independent confirmation.
Trader decision framework
| Recorded direction | Bearish |
|---|---|
| Reference price | $3,574.21 |
| Overhead / reference band | Reference band spanning saved price · $3,560.00–$3,600.00 |
| Bullish condition | Sustained reclaim and confirmed improvement in shorter-timeframe structure. |
| Bearish condition | Confirmed rejection or fresh breakdown with follow-through. |
| Risk / no-trade filter | Do not chase stretched candles. Define invalidation and risk before entry. |
London Session20 Nov 2026, 08:11 UTC · Bearish · View charts and analysis
London — Recorded Chart Review
XAUUSD enters the London reporting window with its broader bearish structure intact despite an emerging intraday recovery. The 4H chart continues to display successive lower highs and lower lows, while RSI at 21.99 indicates deeply oversold momentum following sustained selling pressure. The hourly chart confirms the prevailing decline, although a rebound from the recent lows has lifted RSI to 32.57.
On the 15-minute timeframe, improving price action and RSI at 57.37 indicate strengthening short-term buying interest. The 3560–3600 decision zone is critical for assessing whether this recovery can develop into a more sustained advance. Holding above 3560 supports further testing of 3580 and 3600, while a confirmed breakout above 3600 would improve the near-term outlook. Rejection beneath resistance, followed by a break below 3540, would reinforce bearish continuation toward 3520 and 3500.
View Detailed Technical Analysis 4H / 1H / 15M, price levels & scenarios
Multi-timeframe structural assessment
| Horizon | Trend | RSI | Momentum condition | Reference |
|---|---|---|---|---|
| 4H · Primary | Bearish | 21.99 | Oversold | $3,600.00 |
| 1H · Tactical | Bearish | 32.57 | Between 30 and 70 | $3,580.00 |
| 15M · Execution | Bullish | 57.37 | Between 30 and 70 | $3,560.00 |
Direction and market structure are separate chart labels. A bearish trend with a sideways structure label is possible; neither label independently confirms a trade.
4H · Institutional structure
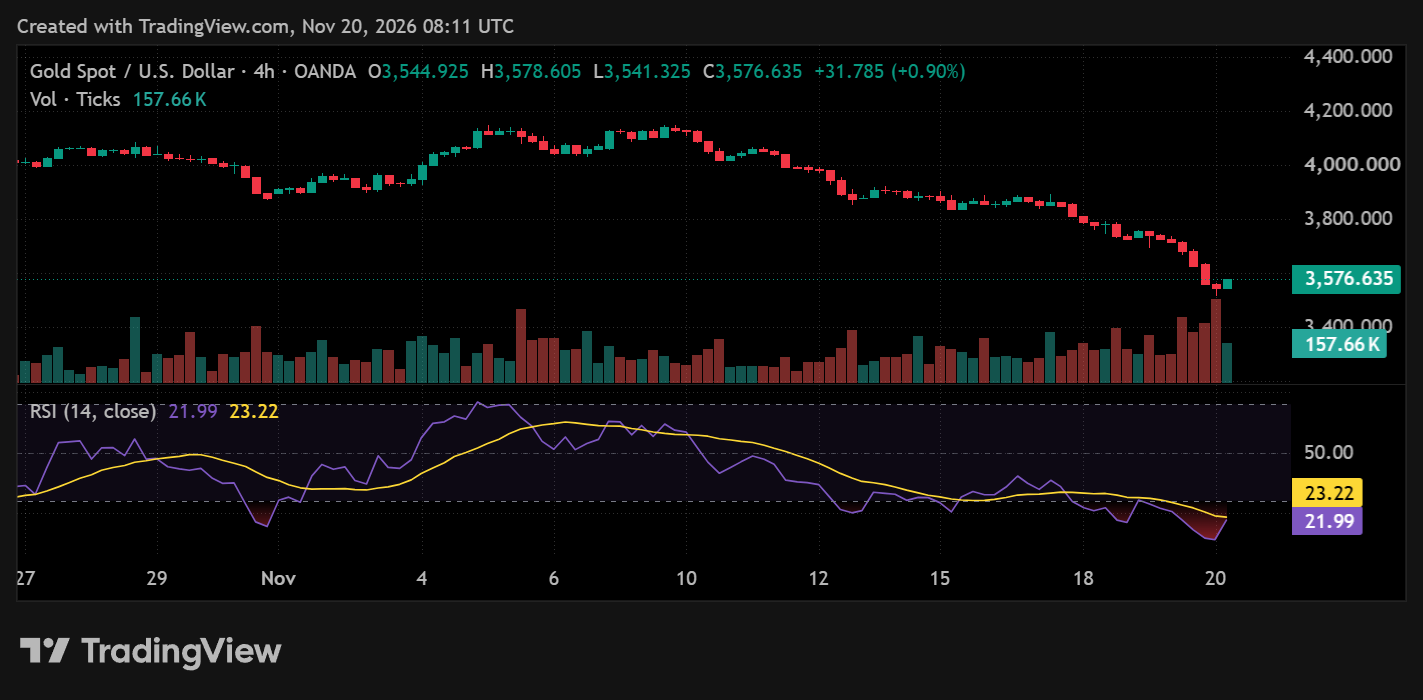
Technical reading: The 4H chart has a bearish trend classification and RSI 21.99. Momentum is oversold; a rebound is possible, but RSI alone cannot confirm a reversal.
Price reference: $3,600.00. Confirm acceptance or rejection on completed candles; the chart reference is not an automatic entry signal.
1H · Tactical confirmation
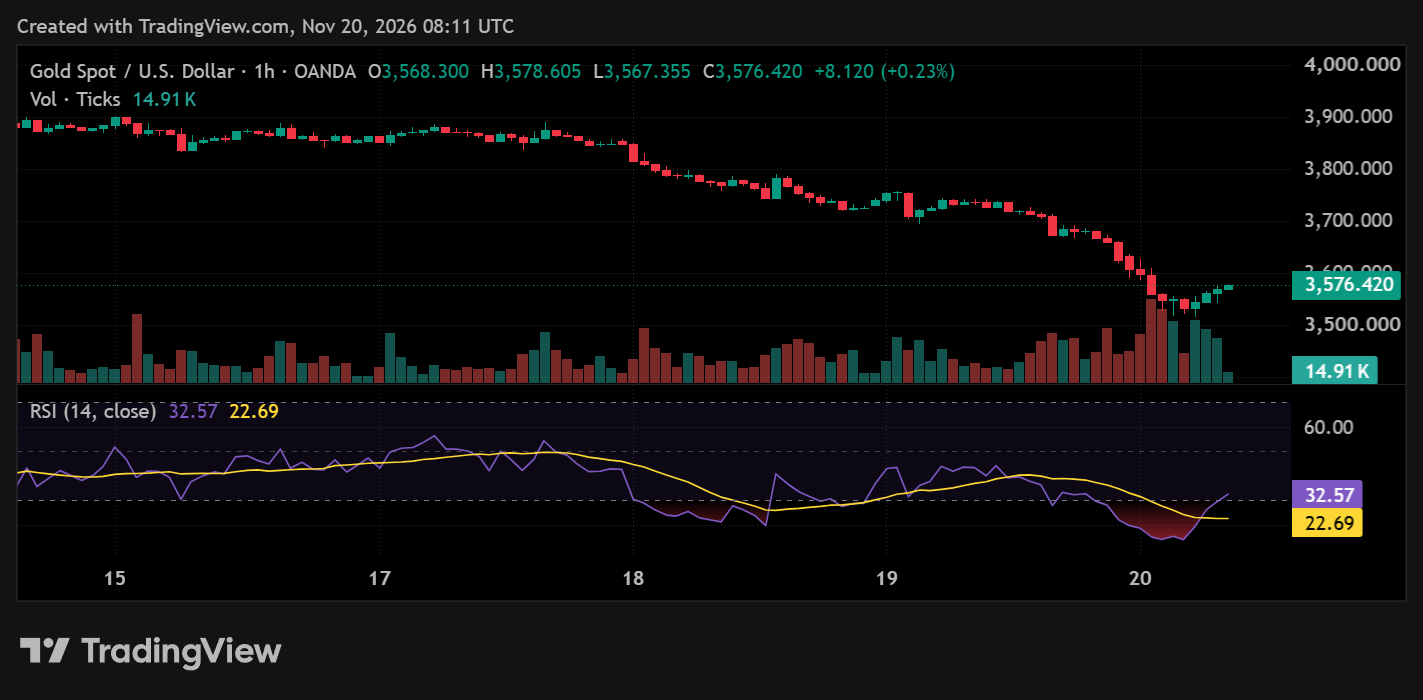
Technical reading: The 1H chart has a bearish trend classification and RSI 32.57. RSI is outside conventional extreme zones; watch for directional follow-through and confirmed swing structure.
Price reference: $3,580.00. Confirm acceptance or rejection on completed candles; the chart reference is not an automatic entry signal.
15M · Execution context
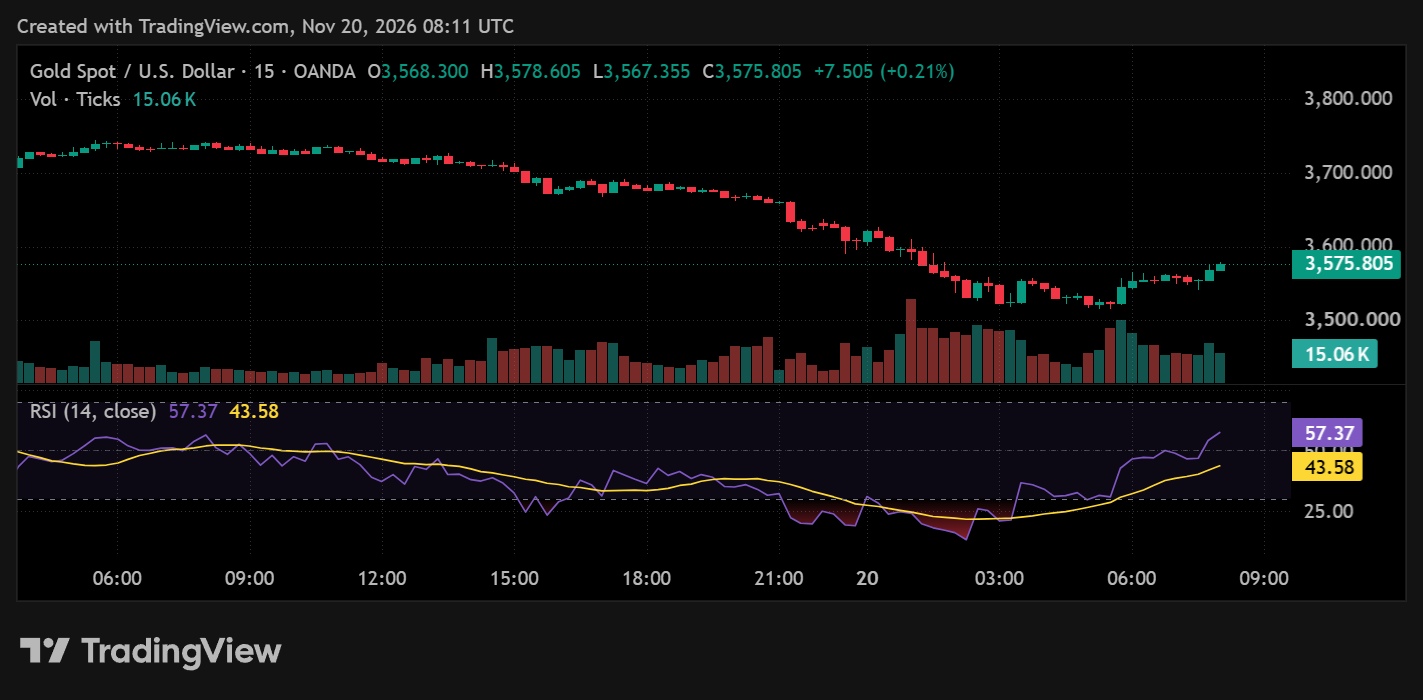
Technical reading: The 15M chart has a bullish trend classification and RSI 57.37. RSI is outside conventional extreme zones; watch for directional follow-through and confirmed swing structure.
Price reference: $3,560.00. Confirm acceptance or rejection on completed candles; the chart reference is not an automatic entry signal.
Key price levels & structural map
Recorded chart levels are sorted by price, not by indicator category. Levels above the saved price are overhead references; they are not confirmed active support.
| Price | Chart source | Relative to saved price | Trader interpretation |
|---|---|---|---|
| $3,450.00 | Support · timeframe unspecified | Below · $125.81 away | Potential lower reference; confirm it still holds. |
| $3,500.00 | Support · timeframe unspecified | Below · $75.80 away | Potential lower reference; confirm it still holds. |
| $3,520.00 | Support · timeframe unspecified | Below · $55.80 away | Potential lower reference; confirm it still holds. |
| $3,540.00 | Support · timeframe unspecified | Below · $35.80 away | Potential lower reference; confirm it still holds. |
| $3,560.00 | Support · timeframe unspecified | Below · $15.80 away | Potential lower reference; confirm it still holds. |
| $3,580.00 | Resistance · timeframe unspecified | Above · $4.20 away | Overhead resistance; monitor the reaction on approach. |
| $3,600.00 | Resistance · timeframe unspecified | Above · $24.20 away | Overhead resistance; monitor the reaction on approach. |
| $3,625.00 | Resistance · timeframe unspecified | Above · $49.20 away | Overhead resistance; monitor the reaction on approach. |
| $3,650.00 | Resistance · timeframe unspecified | Above · $74.20 away | Overhead resistance; monitor the reaction on approach. |
| $3,700.00 | Resistance · timeframe unspecified | Above · $124.20 away | Overhead resistance; monitor the reaction on approach. |
Nearest recorded overhead reference: $3,580.00 (4.20 above the saved price).
Bullish, bearish & no-trade scenarios
Watch: A reclaim of an overhead reference with improving 15M and 1H structure.
Invalidation: A failed reclaim or a fresh confirmed lower low.
Watch: Rejection at overhead references and renewed lower highs/lows on completed candles.
Invalidation: Sustained acceptance above a relevant structural reference.
Watch: No confirmed setup, stretched momentum or conflicting chart signals.
Invalidation: A clear breakout/retest with independent confirmation.
Trader decision framework
| Recorded direction | Bearish |
|---|---|
| Reference price | $3,575.81 |
| Overhead / reference band | Reference band spanning saved price · $3,560.00–$3,600.00 |
| Bullish condition | Sustained reclaim and confirmed improvement in shorter-timeframe structure. |
| Bearish condition | Confirmed rejection or fresh breakdown with follow-through. |
| Risk / no-trade filter | Do not chase stretched candles. Define invalidation and risk before entry. |
Morning Session20 Nov 2026, 02:36 UTC · Bearish · View charts and analysis
Morning — Recorded Chart Review
XAUUSD maintains a pronounced bearish structure across the 4H, 1H and 15M timeframes, with successive lower highs and lower lows confirming sustained selling pressure. The latest decline has pushed gold toward the 3525 support region, accompanied by elevated selling activity and sharply deteriorating momentum. RSI readings near 13 across all three timeframes indicate exceptionally oversold conditions, increasing the possibility of temporary corrective rebounds without establishing a confirmed bullish reversal.
The immediate decision zone stands at 3525–3560. Sustained trading below 3560 preserves the bearish outlook, while a decisive break beneath 3525 could expose 3500, followed by 3475 and 3450. Conversely, recovery above 3547 and 3560 would indicate improving short-term stabilization, with 3600 representing the next significant resistance. Traders should monitor price acceptance around support and avoid interpreting oversold momentum alone as confirmation of a durable bottom.
View Detailed Technical Analysis 4H / 1H / 15M, price levels & scenarios
Multi-timeframe structural assessment
| Horizon | Trend | RSI | Momentum condition | Reference |
|---|---|---|---|---|
| 4H · Primary | Bearish | 13.64 | Oversold | $3,560.00 |
| 1H · Tactical | Bearish | 13.15 | Oversold | $3,560.00 |
| 15M · Execution | Bearish | 13.64 | Oversold | $3,547.00 |
Direction and market structure are separate chart labels. A bearish trend with a sideways structure label is possible; neither label independently confirms a trade.
4H · Institutional structure
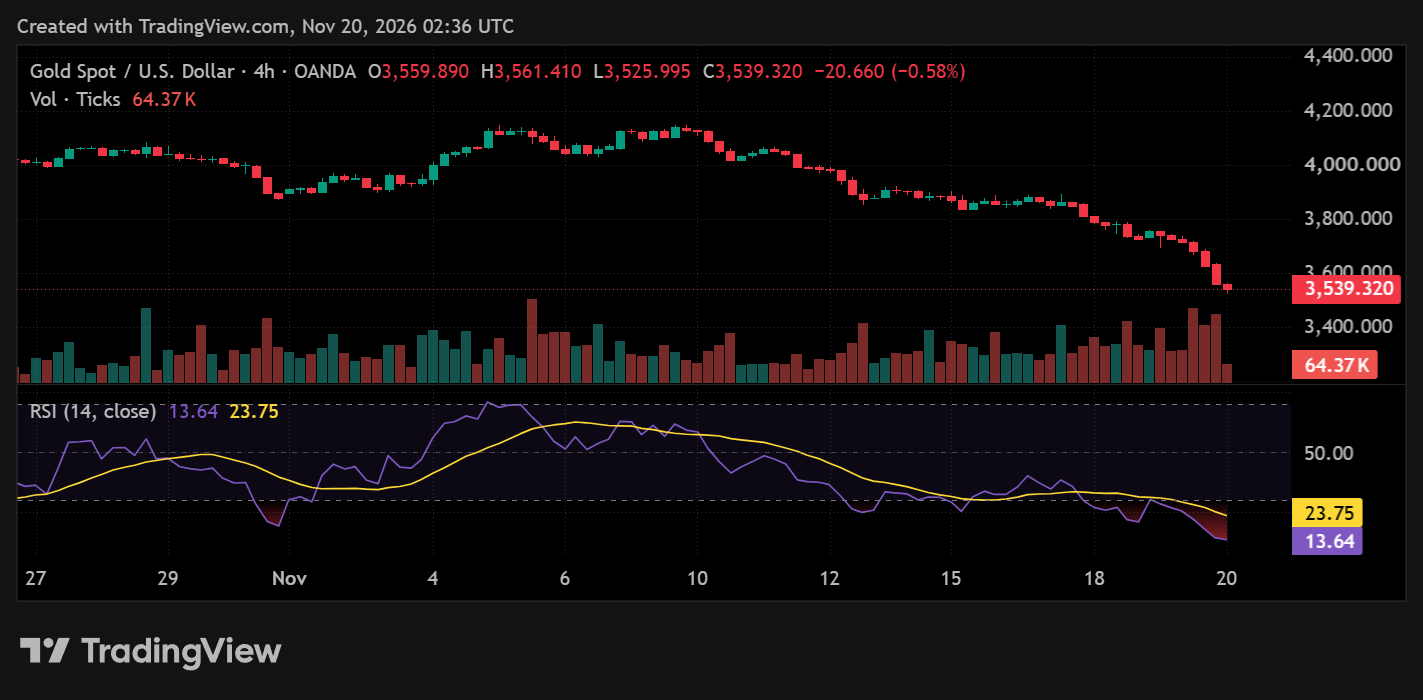
Technical reading: The 4H chart has a bearish trend classification and RSI 13.64. Momentum is oversold; a rebound is possible, but RSI alone cannot confirm a reversal.
Price reference: $3,560.00. Confirm acceptance or rejection on completed candles; the chart reference is not an automatic entry signal.
1H · Tactical confirmation
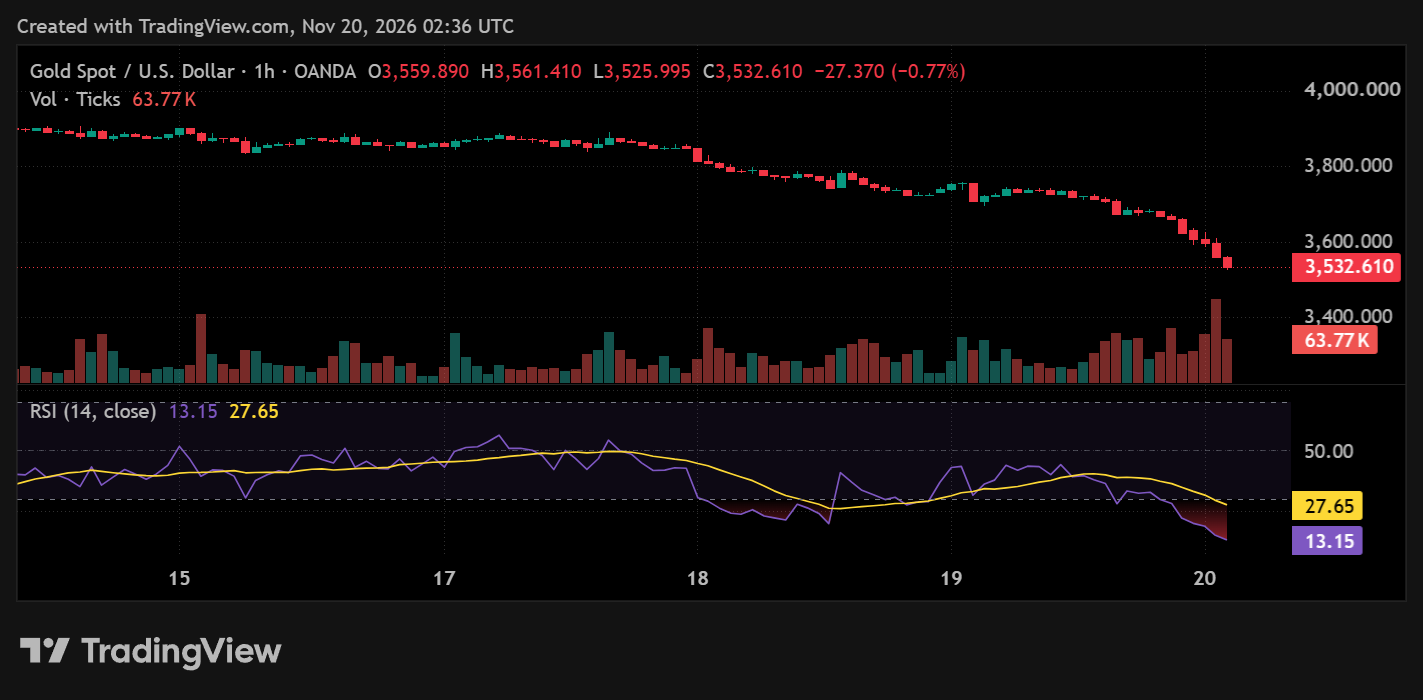
Technical reading: The 1H chart has a bearish trend classification and RSI 13.15. Momentum is oversold; a rebound is possible, but RSI alone cannot confirm a reversal.
Price reference: $3,560.00. Confirm acceptance or rejection on completed candles; the chart reference is not an automatic entry signal.
15M · Execution context
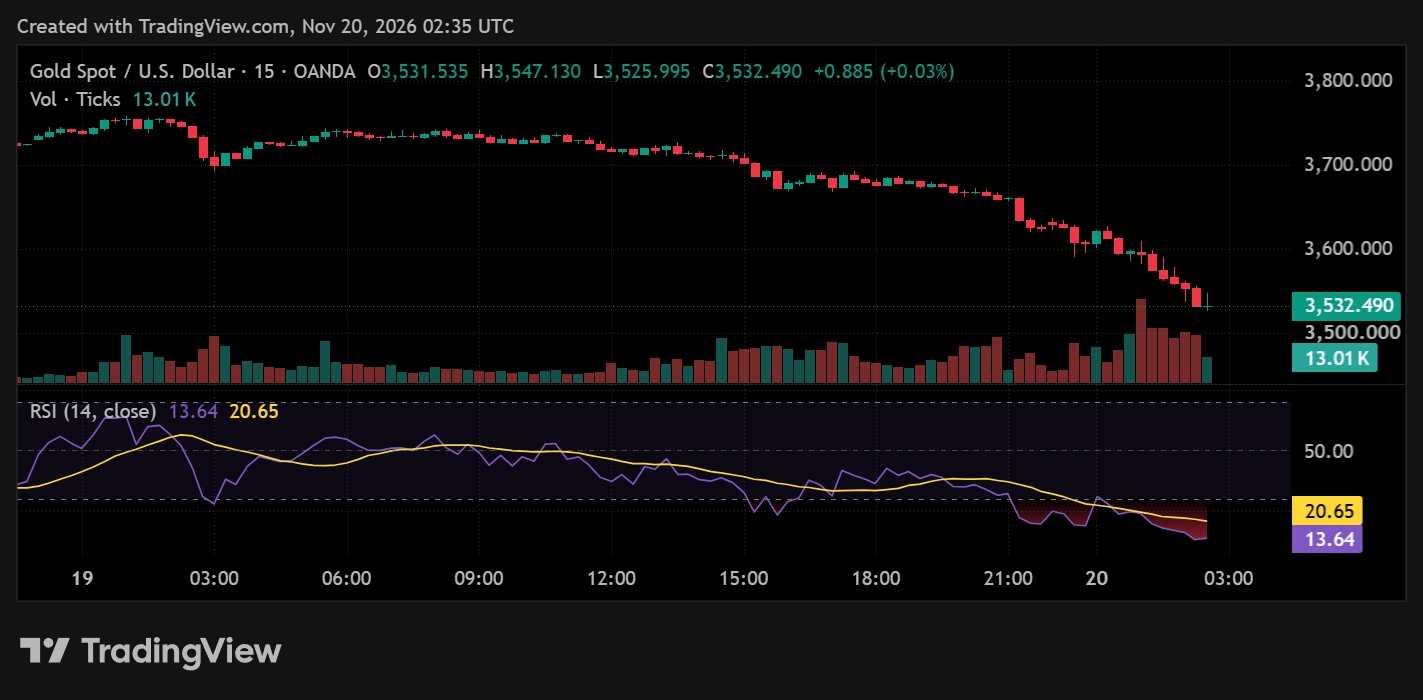
Technical reading: The 15M chart has a bearish trend classification and RSI 13.64. Momentum is oversold; a rebound is possible, but RSI alone cannot confirm a reversal.
Price reference: $3,547.00. Confirm acceptance or rejection on completed candles; the chart reference is not an automatic entry signal.
Key price levels & structural map
Recorded chart levels are sorted by price, not by indicator category. Levels above the saved price are overhead references; they are not confirmed active support.
| Price | Chart source | Relative to saved price | Trader interpretation |
|---|---|---|---|
| $3,400.00 | Support · timeframe unspecified | Below · $132.49 away | Potential lower reference; confirm it still holds. |
| $3,450.00 | Support · timeframe unspecified | Below · $82.49 away | Potential lower reference; confirm it still holds. |
| $3,475.00 | Support · timeframe unspecified | Below · $57.49 away | Potential lower reference; confirm it still holds. |
| $3,500.00 | Support · timeframe unspecified | Below · $32.49 away | Potential lower reference; confirm it still holds. |
| $3,525.00 | Support · timeframe unspecified | Below · $7.49 away | Potential lower reference; confirm it still holds. |
| $3,547.00 | Resistance · timeframe unspecified | Above · $14.51 away | Overhead resistance; monitor the reaction on approach. |
| $3,560.00 | Resistance · timeframe unspecified | Above · $27.51 away | Overhead resistance; monitor the reaction on approach. |
| $3,600.00 | Resistance · timeframe unspecified | Above · $67.51 away | Overhead resistance; monitor the reaction on approach. |
| $3,650.00 | Resistance · timeframe unspecified | Above · $117.51 away | Overhead resistance; monitor the reaction on approach. |
| $3,700.00 | Resistance · timeframe unspecified | Above · $167.51 away | Overhead resistance; monitor the reaction on approach. |
Nearest recorded overhead reference: $3,547.00 (14.51 above the saved price).
Bullish, bearish & no-trade scenarios
Watch: A reclaim of an overhead reference with improving 15M and 1H structure.
Invalidation: A failed reclaim or a fresh confirmed lower low.
Watch: Rejection at overhead references and renewed lower highs/lows on completed candles.
Invalidation: Sustained acceptance above a relevant structural reference.
Watch: No confirmed setup, stretched momentum or conflicting chart signals.
Invalidation: A clear breakout/retest with independent confirmation.
Trader decision framework
| Recorded direction | Bearish |
|---|---|
| Reference price | $3,532.49 |
| Overhead / reference band | Reference band spanning saved price · $3,525.00–$3,560.00 |
| Bullish condition | Sustained reclaim and confirmed improvement in shorter-timeframe structure. |
| Bearish condition | Confirmed rejection or fresh breakdown with follow-through. |
| Risk / no-trade filter | Do not chase stretched candles. Define invalidation and risk before entry. |