
XAUUSD Technical Analysis — November 2026

Gold Monthly Review & Research Archive
Historical price structure · Support and resistance · 4H / 1H / 15M research · 15 published daily reports
November 2026XAUUSD / Spot GoldMONTH TO DATE · UPDATED DAILY
November 2026 Gold Market Overview
This month-to-date research brings together ForexDevice’s published daily XAUUSD technical analyses. It tracks recorded price references, evolving directional outlooks and historically noted support and resistance. Newer reports may change the interpretation of earlier observations.
Recorded reference change: -329.32 USD (-8.44%) between the first and latest available intraday reference prices. This is not an official monthly return or closing-price comparison.
XAUUSD 4H Chart — Latest Available Price Structure
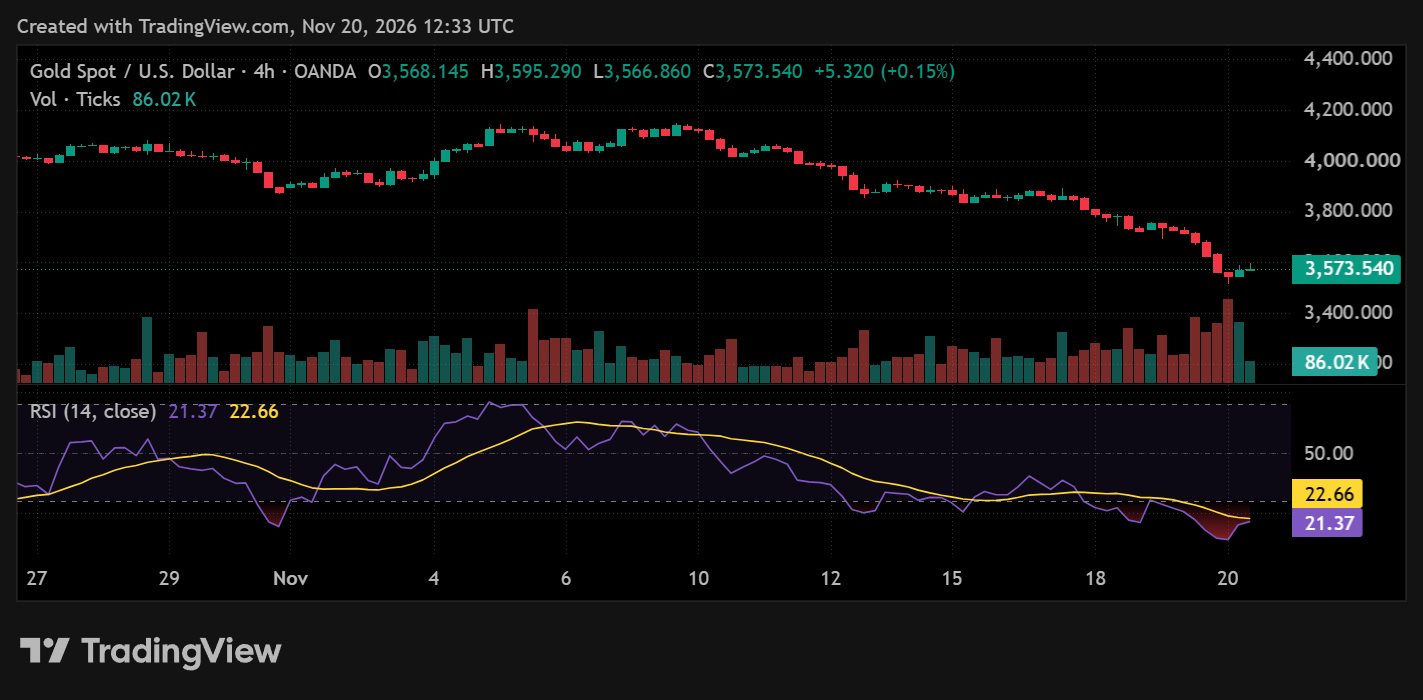
Chart from 20 November 2026 daily analysis · Verify the chart timestamp and price feed in the original report.
XAUUSD Support and Resistance Levels — November 2026
The areas below were referenced on multiple dates in published ForexDevice research. Their roles describe how the daily reports labelled them, not independently verified price reactions. Single-day levels remain in the complete archive.
| Recorded price area | Historical role | What the research recorded | Evidence |
|---|---|---|---|
| $4,125.00–$4,135.00 | Recorded resistance area | Daily reports identified resistance within this area on 2 separate dates, from 5 Nov to 9 Nov. Whether sellers rejected the area requires chart verification. | 9 Nov · 5 Nov |
| $4,050.00–$4,055.00 | Recorded resistance area | Daily reports identified resistance within this area on 3 separate dates, from 4 Nov to 11 Nov. Whether sellers rejected the area requires chart verification. | 11 Nov · 6 Nov · 4 Nov |
| $4,030.00–$4,040.00 | Recorded support area | Daily reports identified support within this area on 4 separate dates, from 4 Nov to 11 Nov. Whether buyers defended the area requires chart verification. | 11 Nov · 10 Nov · 6 Nov · 4 Nov |
| $3,900.00–$3,910.00 | Recorded as both support and resistance | This price area appeared as support in 2 recorded observations and resistance in 2 recorded observations. The labels vary across the dated reports; this alone does not establish a confirmed role reversal. | 13 Nov · 3 Nov · 2 Nov |
| $3,850.00–$3,860.00 | Recorded as both support and resistance | This price area appeared as support in 2 recorded observations and resistance in 1 recorded observation. The labels vary across the dated reports; this alone does not establish a confirmed role reversal. | 17 Nov · 16 Nov |
Method: recorded levels are grouped by proximity (the greater of $12 or 0.3% of price). Only areas observed on two or more distinct dates appear here; the complete daily history below retains all dates. Grouping does not prove chart reactions.
How Gold’s Recorded Outlook Evolved During November 2026
2 Nov–6 Nov: Recorded research developments
5 published daily reports in this period. Reference prices ranged from $3,903.53 to $4,125.40 across the available snapshots. Recorded daily outlooks: 3 Bearish 2 Bullish. From the first to last available intraday reference in this period: +144.61 USD. These are different intraday snapshots, not weekly closing prices. Review the dated reports below for the original 4H, 1H and 15M interpretation; these summary counts do not establish a chart trend by themselves.
9 Nov–13 Nov: Recorded research developments
5 published daily reports in this period. Reference prices ranged from $3,892.43 to $4,119.66 across the available snapshots. Recorded daily outlooks: 1 Bullish 4 Bearish. From the first to last available intraday reference in this period: -227.23 USD. These are different intraday snapshots, not weekly closing prices. Review the dated reports below for the original 4H, 1H and 15M interpretation; these summary counts do not establish a chart trend by themselves.
16 Nov–20 Nov: Recorded research developments
5 published daily reports in this period. Reference prices ranged from $3,574.21 to $3,869.09 across the available snapshots. Recorded daily outlooks: 5 Bearish. From the first to last available intraday reference in this period: -294.88 USD. These are different intraday snapshots, not weekly closing prices. Review the dated reports below for the original 4H, 1H and 15M interpretation; these summary counts do not establish a chart trend by themselves.
All 15 XAUUSD Daily Analysis Reports — November 2026
Each linked report contains the original analysis. Prices below are recorded intraday references, not official daily closes.
2 Nov–6 Nov · Research archive
| Date | Recorded price | Archive outlook | Support / resistance | Article |
|---|---|---|---|---|
| 2 Nov | $3,903.53 | Bearish | $3,900.00 / $3,910.00 | Full report |
| 3 Nov | $3,914.18 | Bearish | $3,900.00 / $3,920.00 | Full report |
| 4 Nov | $4,045.92 | Bullish | $4,030.00 / $4,052.00 | Full report |
| 5 Nov | $4,125.40 | Bullish | $4,120.00 / $4,135.00 | Full report |
| 6 Nov | $4,048.14 | Bearish | $4,030.00 / $4,055.00 | Full report |
9 Nov–13 Nov · Research archive
| Date | Recorded price | Archive outlook | Support / resistance | Article |
|---|---|---|---|---|
| 9 Nov | $4,119.66 | Bullish | $4,110.00 / $4,125.00 | Full report |
| 10 Nov | $4,050.93 | Bearish | $4,040.00 / $4,075.00 | Full report |
| 11 Nov | $4,040.66 | Bearish | $4,040.00 / $4,050.00 | Full report |
| 12 Nov | $3,935.97 | Bearish | $3,930.00 / $3,950.00 | Full report |
| 13 Nov | $3,892.43 | Bearish | $3,880.00 / $3,900.00 | Full report |
16 Nov–20 Nov · Research archive
| Date | Recorded price | Archive outlook | Support / resistance | Article |
|---|---|---|---|---|
| 16 Nov | $3,869.09 | Bearish | $3,860.00 / $3,880.00 | Full report |
| 17 Nov | $3,856.52 | Bearish | $3,850.00 / $3,860.00 | Full report |
| 18 Nov | $3,776.60 | Bearish | $3,770.00 / $3,780.00 | Full report |
| 19 Nov | $3,714.26 | Bearish | $3,710.00 / $3,725.00 | Full report |
| 20 Nov | $3,574.21 | Bearish | $3,560.00 / $3,580.00 | Full report |
Complete Daily Support and Resistance History
Every published daily report with extracted support/resistance appears below. These are dated observations, not current signals.
| Research date | Recorded support | Recorded resistance | Source |
|---|---|---|---|
| 20 Nov | $3,560.00 | $3,580.00 | Daily report |
| 19 Nov | $3,710.00 | $3,725.00 | Daily report |
| 18 Nov | $3,770.00 | $3,780.00 | Daily report |
| 17 Nov | $3,850.00 | $3,860.00 | Daily report |
| 16 Nov | $3,860.00 | $3,880.00 | Daily report |
| 13 Nov | $3,880.00 | $3,900.00 | Daily report |
| 12 Nov | $3,930.00 | $3,950.00 | Daily report |
| 11 Nov | $4,040.00 | $4,050.00 | Daily report |
| 10 Nov | $4,040.00 | $4,075.00 | Daily report |
| 9 Nov | $4,110.00 | $4,125.00 | Daily report |
| 6 Nov | $4,030.00 | $4,055.00 | Daily report |
| 5 Nov | $4,120.00 | $4,135.00 | Daily report |
| 4 Nov | $4,030.00 | $4,052.00 | Daily report |
| 3 Nov | $3,900.00 | $3,920.00 | Daily report |
| 2 Nov | $3,900.00 | $3,910.00 | Daily report |
Five Ways to Use This Month’s Gold Research
- Compare timeframes: Review the original 4H trend alongside the 1H and 15M outlooks.
- Track level changes: Compare recorded support and resistance across dates rather than assuming they remain valid.
- Separate snapshots from closes: Intraday reference prices are not a monthly performance series.
- Verify the latest chart: Use the date-linked 4H image and original report before interpreting current structure.
- Review earlier calls: Use the archive to compare recorded outlooks with subsequent observations, including limitations.
November 2026 XAUUSD Technical Analysis — FAQ
Is this the completed monthly report?
No. This is a month-to-date report and is updated when additional verified daily research becomes available.
Where are the original XAUUSD charts?
Use the linked daily reports and the latest available 4H chart above to inspect the source images.
Are these official monthly gold returns?
No. The reference prices were recorded at different intraday times and are not official open or closing prices.
Can historical support and resistance be traded today?
Not without fresh chart analysis and independent verification; market conditions change.